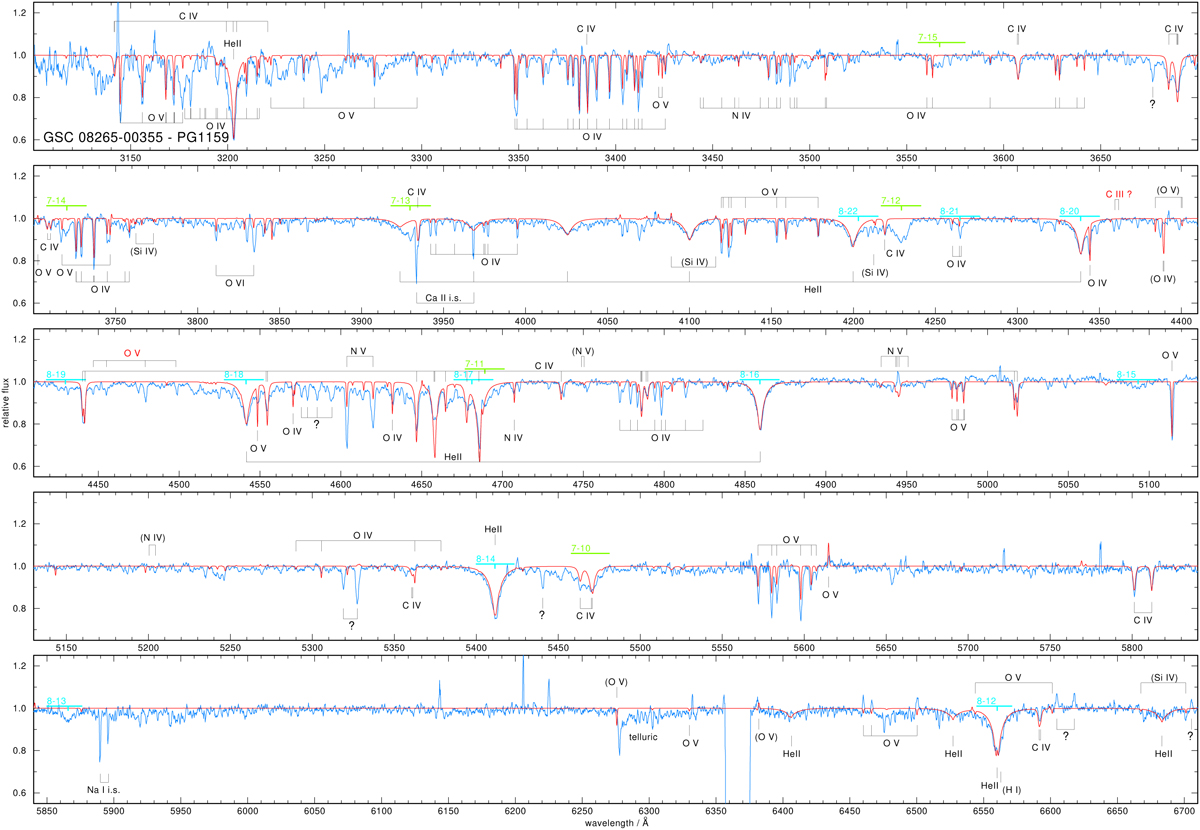
Fig. A.2
Download original image
Like Fig. A.1, but for the PG1159 star GSC 08265. Overplotted is the final model (red) with Teff = 72 000 K, log g = 4.8, and element abundances as given in Table 2. Red identification labels indicate lines that are not included in the model. Note the presence of highly excited C IV lines at locations indicated by horizontal blue and green bars (with principal quantum numbers marked). They are not included in the model except for the 7 → 10 transitions at 5470 Å. Question marks indicate unidentified photospheric lines.
Current usage metrics show cumulative count of Article Views (full-text article views including HTML views, PDF and ePub downloads, according to the available data) and Abstracts Views on Vision4Press platform.
Data correspond to usage on the plateform after 2015. The current usage metrics is available 48-96 hours after online publication and is updated daily on week days.
Initial download of the metrics may take a while.