Fig. 6.
Download original image
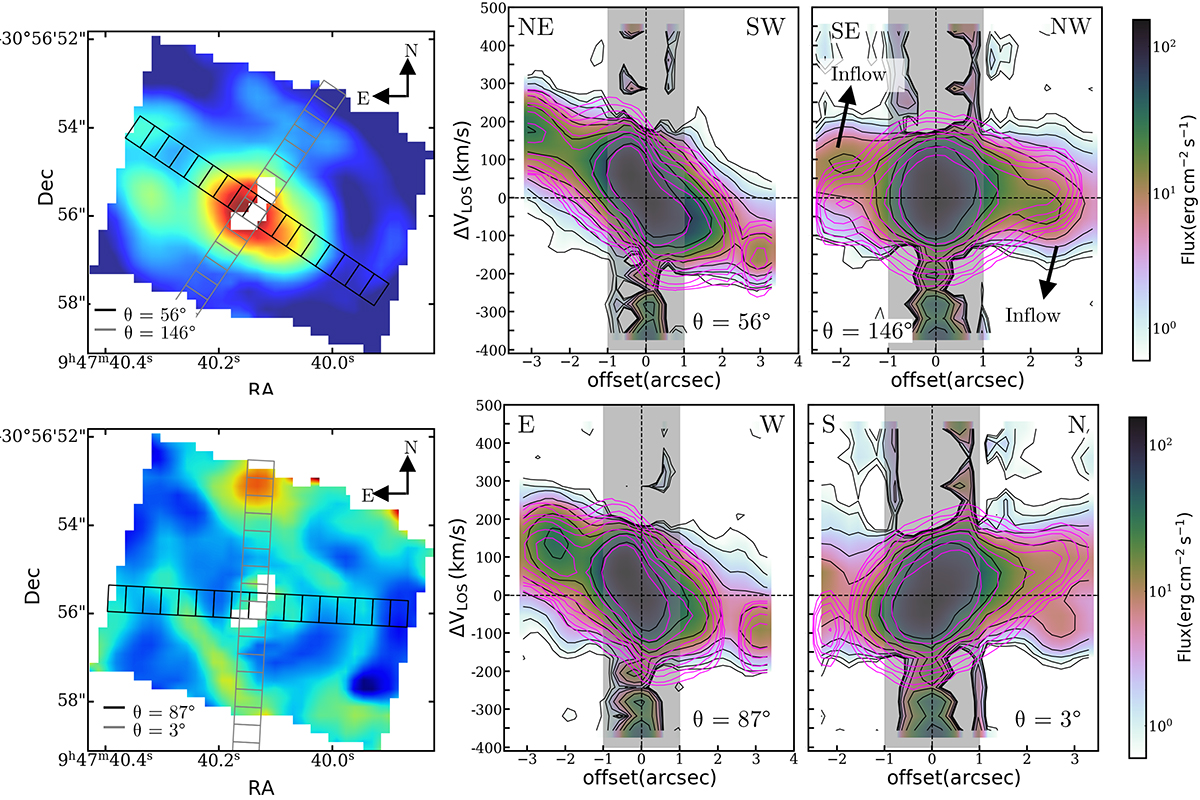
PVDs of the S(1) line. Left panels: Flux and velocity dispersion maps obtained using bilinear interpolation, with the regions used to extract the PVDs superimposed, which have a size of 0![]() 6 × 7″. Middle and right panels: PVDs extracted along the kinematic major and minor axes determined by 3DBAROLO (top) and along PA = 87° and 3° (bottom). The black and magenta contours correspond to the data and rotating disk model above 2σ (see Sect. 3.2.3). The high-velocity emissions observed between –1 and 1 arcsec correspond to artifacts in the nuclear region because of the strong AGN continuum and derived low EW of the molecular emission lines there.
6 × 7″. Middle and right panels: PVDs extracted along the kinematic major and minor axes determined by 3DBAROLO (top) and along PA = 87° and 3° (bottom). The black and magenta contours correspond to the data and rotating disk model above 2σ (see Sect. 3.2.3). The high-velocity emissions observed between –1 and 1 arcsec correspond to artifacts in the nuclear region because of the strong AGN continuum and derived low EW of the molecular emission lines there.
Current usage metrics show cumulative count of Article Views (full-text article views including HTML views, PDF and ePub downloads, according to the available data) and Abstracts Views on Vision4Press platform.
Data correspond to usage on the plateform after 2015. The current usage metrics is available 48-96 hours after online publication and is updated daily on week days.
Initial download of the metrics may take a while.