Open Access
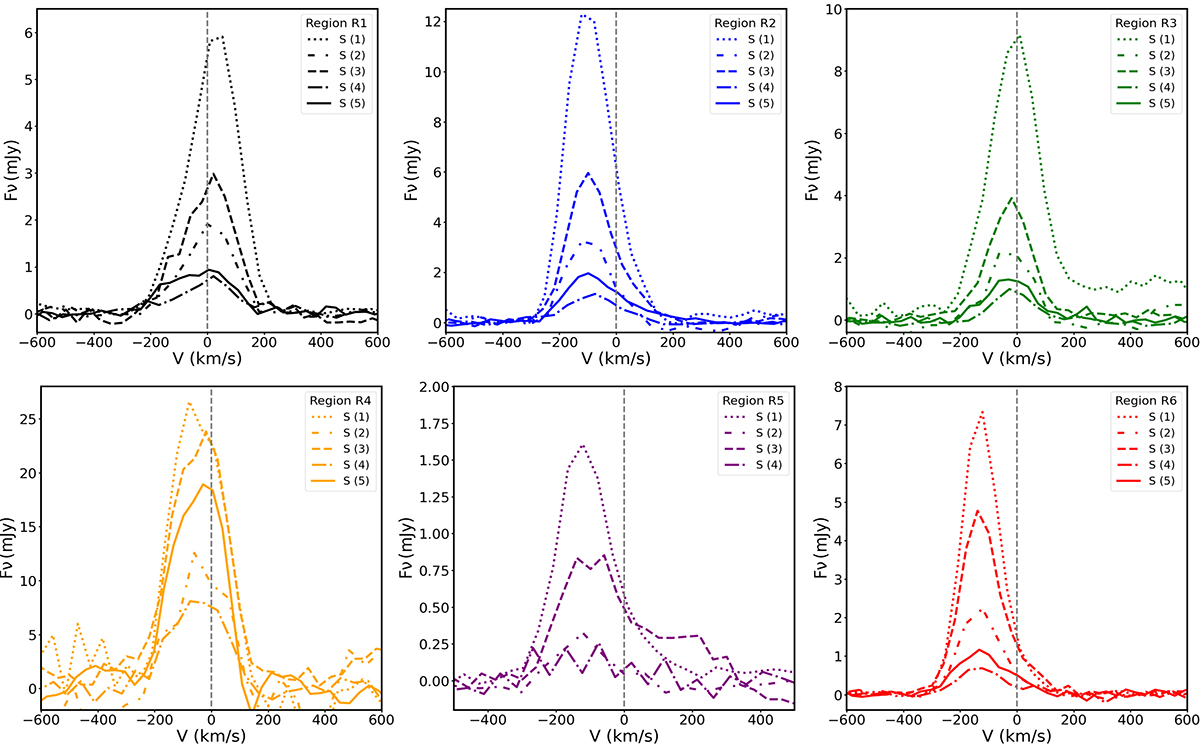
Fig. 5.
Download original image
Emission line profiles of the five H2 emission lines extracted from the regions with matching colors indicated in Fig. 4. All the velocities refer to the systemic value computed with z = 0.008486, indicated by the dashed vertical black lines.
Current usage metrics show cumulative count of Article Views (full-text article views including HTML views, PDF and ePub downloads, according to the available data) and Abstracts Views on Vision4Press platform.
Data correspond to usage on the plateform after 2015. The current usage metrics is available 48-96 hours after online publication and is updated daily on week days.
Initial download of the metrics may take a while.