Fig. 2.
Download original image
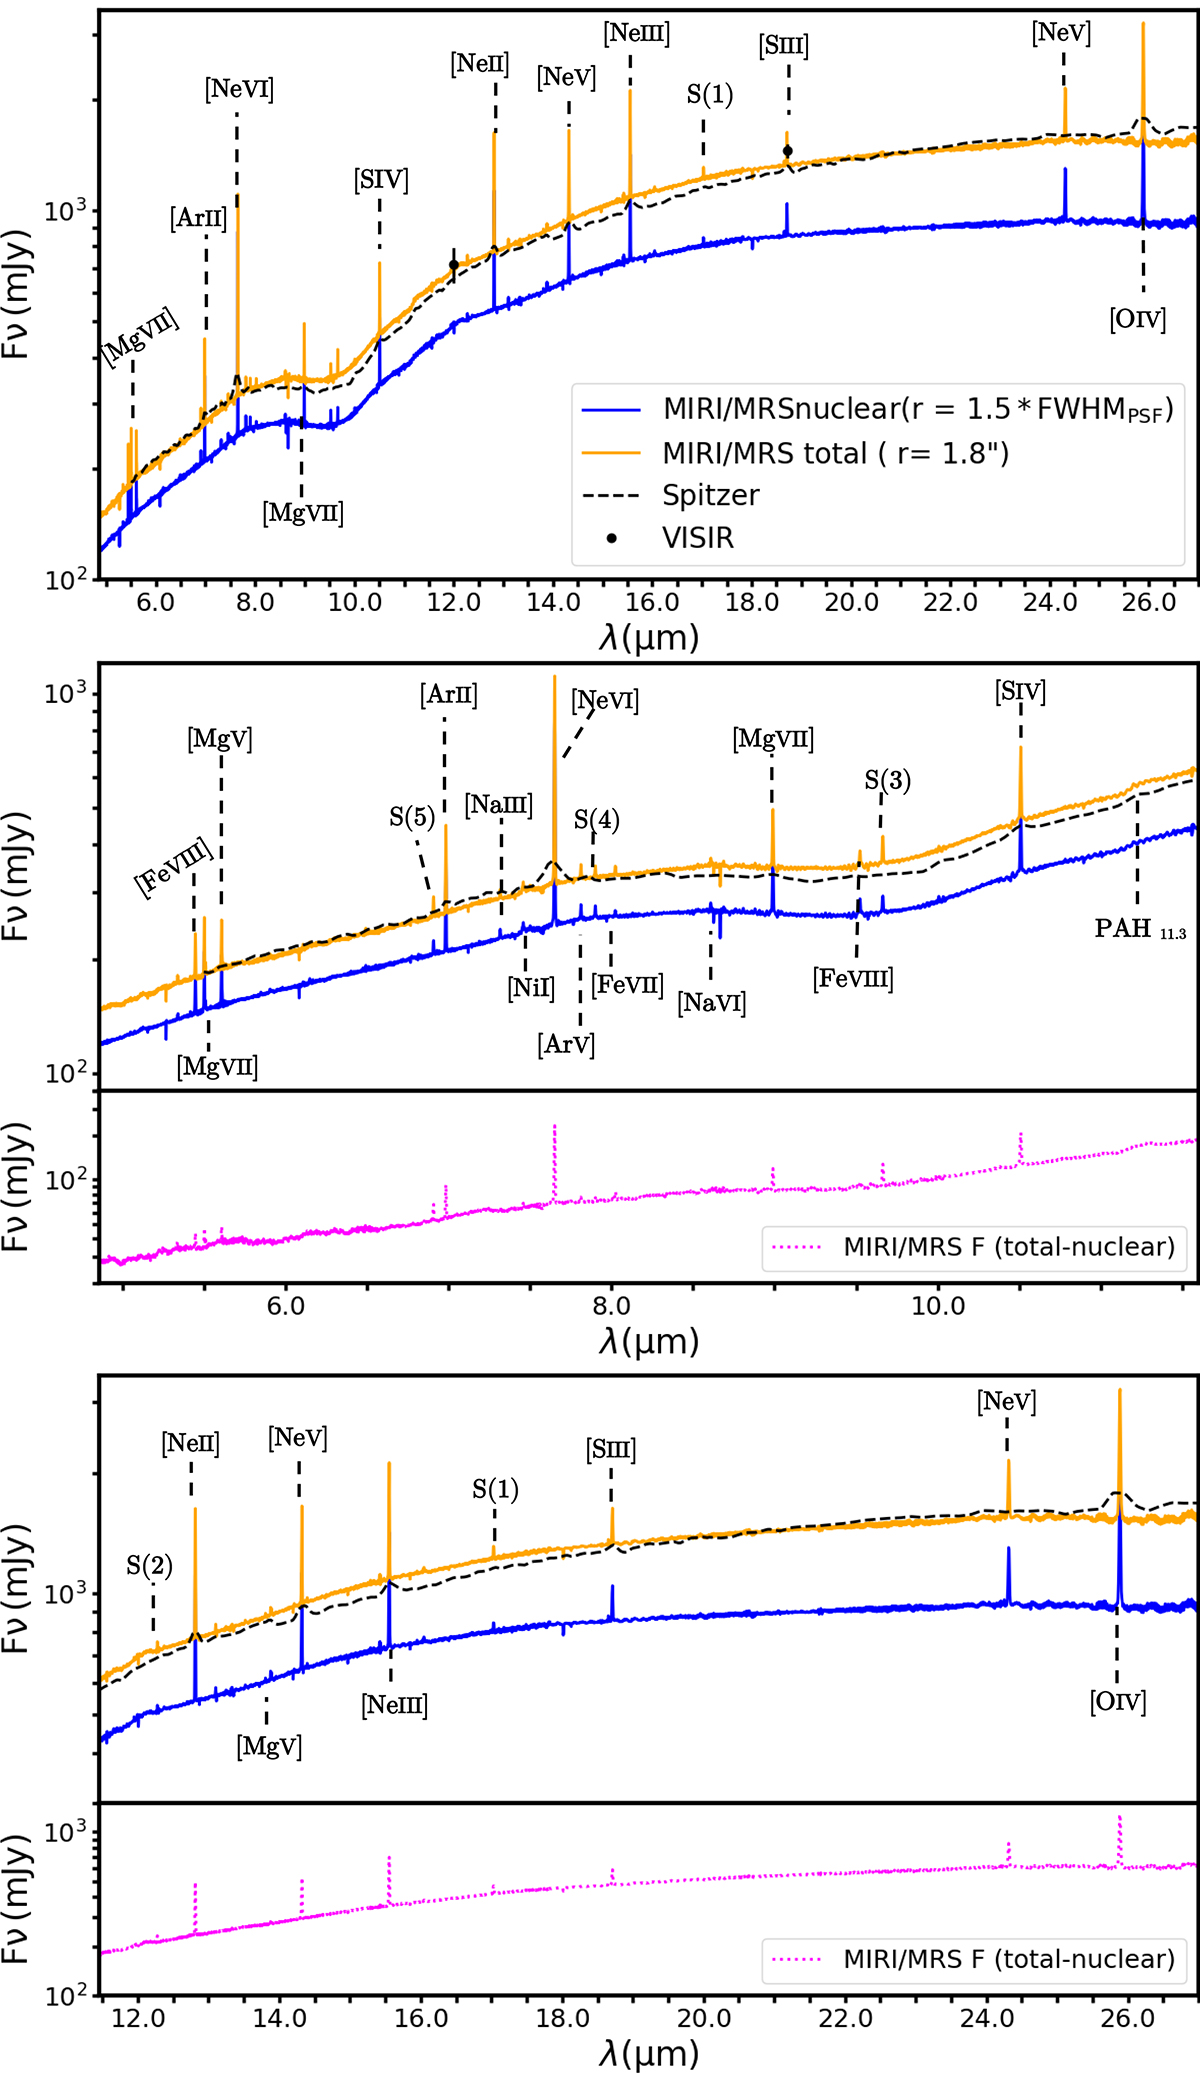
Mid-infrared integrated spectra of MCG−05−23−16. The solid blue and orange lines correspond to the nuclear and extended JWST/MIRI spectra, extracted in circular apertures of ∼0![]() 8−2
8−2![]() 5 (146–441 pc) and 3
5 (146–441 pc) and 3![]() 6 (634 pc) diameter, respectively (black and white circles in Fig. 1). The dotted magenta line represents the spectrum obtained by subtracting the nuclear from the extended spectrum. The dashed black line corresponds to the Spitzer/IRS spectrum, extracted in the same aperture as the extended JWST/MIRI spectrum. The middle and bottom panels show zooms of two spectral regions. The black filled circles mark the nuclear 12 μm and 18 μm continuum emission reported by Asmus et al. (2015), using data from VISIR/VLT.
6 (634 pc) diameter, respectively (black and white circles in Fig. 1). The dotted magenta line represents the spectrum obtained by subtracting the nuclear from the extended spectrum. The dashed black line corresponds to the Spitzer/IRS spectrum, extracted in the same aperture as the extended JWST/MIRI spectrum. The middle and bottom panels show zooms of two spectral regions. The black filled circles mark the nuclear 12 μm and 18 μm continuum emission reported by Asmus et al. (2015), using data from VISIR/VLT.
Current usage metrics show cumulative count of Article Views (full-text article views including HTML views, PDF and ePub downloads, according to the available data) and Abstracts Views on Vision4Press platform.
Data correspond to usage on the plateform after 2015. The current usage metrics is available 48-96 hours after online publication and is updated daily on week days.
Initial download of the metrics may take a while.