Fig. B.2.
Download original image
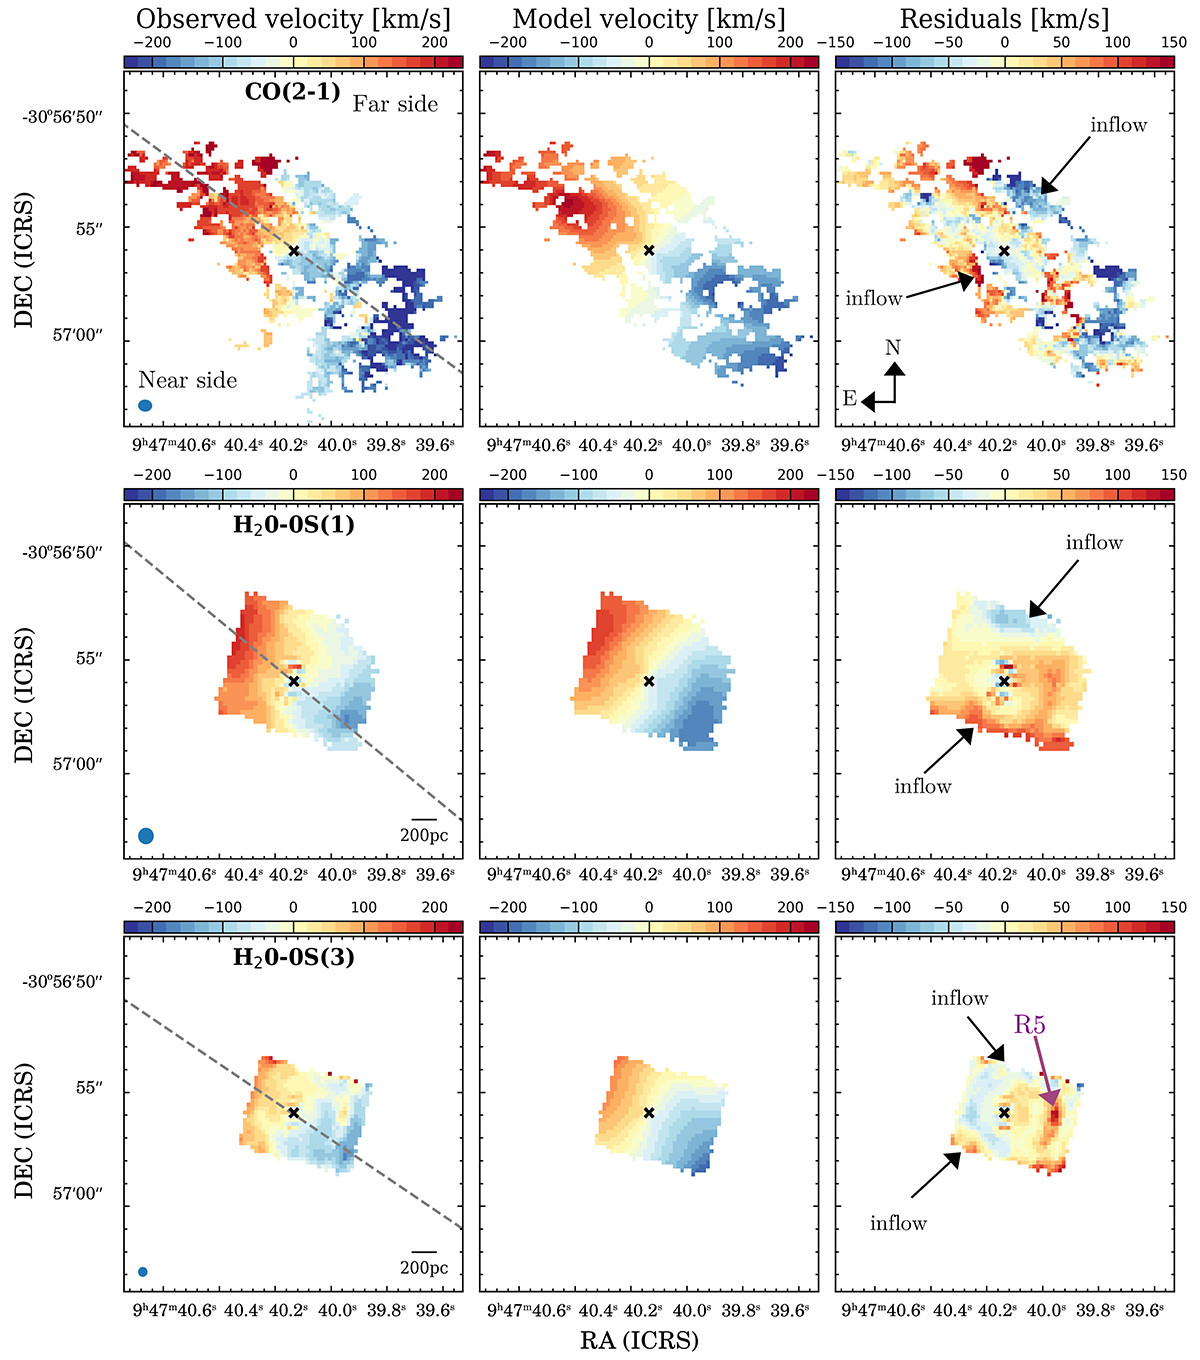
From top to bottom, moment 1 maps of the CO(2−1), H20−0S(1), and H20−0S(3) emission lines. From left to right: data, 3DBAROLO model, and residuals from subtracting the model from the data. The kinematic major axis determined by 3DBAROLO is indicated as a dashed gray line, and the corresponding beam sizes are shown as blue ellipses in the bottom left corner of the left panels. The black cross corresponds to the peak of the ALMA continuum.
Current usage metrics show cumulative count of Article Views (full-text article views including HTML views, PDF and ePub downloads, according to the available data) and Abstracts Views on Vision4Press platform.
Data correspond to usage on the plateform after 2015. The current usage metrics is available 48-96 hours after online publication and is updated daily on week days.
Initial download of the metrics may take a while.