Fig. A.1.
Download original image
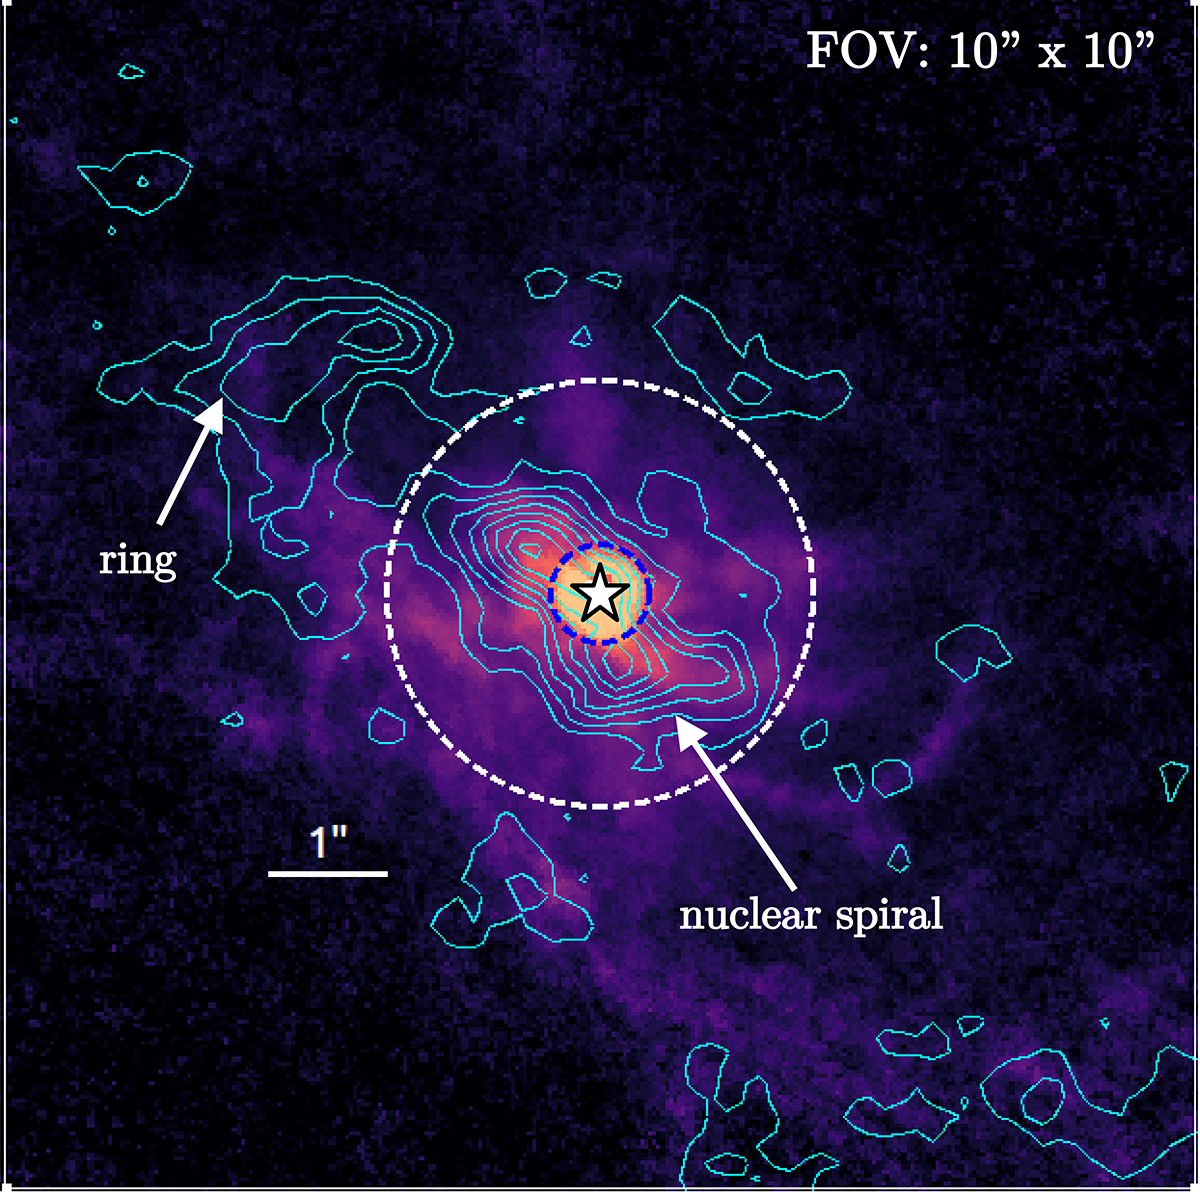
V-H color map obtained using HST/WFC3 images in the F606W and F160W filters. The solid cyan contours correspond to 2.2×10⁻³, 4.4×10⁻³, 6.6×10⁻³, 8.8×10⁻³, 1.1×10⁻², 1.3×10⁻², 1.5×10⁻², 1.7×10⁻², and 2×10⁻² [Jy km/s] ALMA CO(2-1) intensity. The dashed black and blue circles correspond to the regions used to extract the nuclear (diameter of 0![]() 8 - 2
8 - 2![]() 5 ≃ 141-440 pc) and extended (diameter of 3
5 ≃ 141-440 pc) and extended (diameter of 3![]() 6 ≃ 634 pc) JWST/MIRI spectra shown in Fig. 2.
6 ≃ 634 pc) JWST/MIRI spectra shown in Fig. 2.
Current usage metrics show cumulative count of Article Views (full-text article views including HTML views, PDF and ePub downloads, according to the available data) and Abstracts Views on Vision4Press platform.
Data correspond to usage on the plateform after 2015. The current usage metrics is available 48-96 hours after online publication and is updated daily on week days.
Initial download of the metrics may take a while.