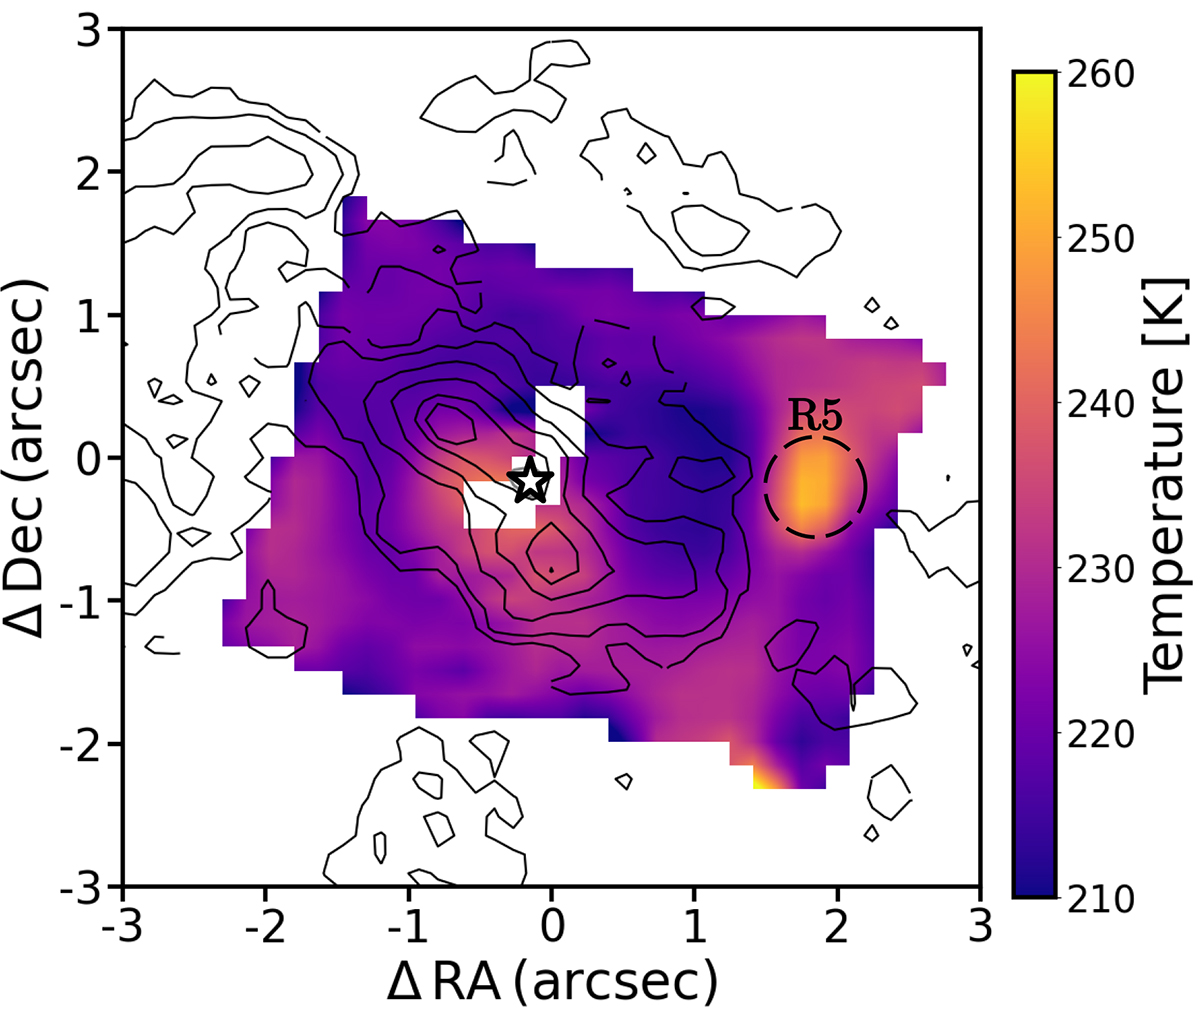
Fig. 10.
Download original image
H2 excitation map derived from the S(1)/S(3) line ratio (see Sect. 3.3). The dashed black circle marks the region R5, also indicated in Fig. 4 and with an arrow in Fig. 7. This region has the highest temperature area on this map, with a temperature of ∼260 K. The solid black contours correspond to 0.2, 0.4, 0.6, 0.8, and 1σ of the CO(2-1) emission. The white star shows the AGN location according to the ALMA continuum.
Current usage metrics show cumulative count of Article Views (full-text article views including HTML views, PDF and ePub downloads, according to the available data) and Abstracts Views on Vision4Press platform.
Data correspond to usage on the plateform after 2015. The current usage metrics is available 48-96 hours after online publication and is updated daily on week days.
Initial download of the metrics may take a while.