Fig. 1.
Download original image
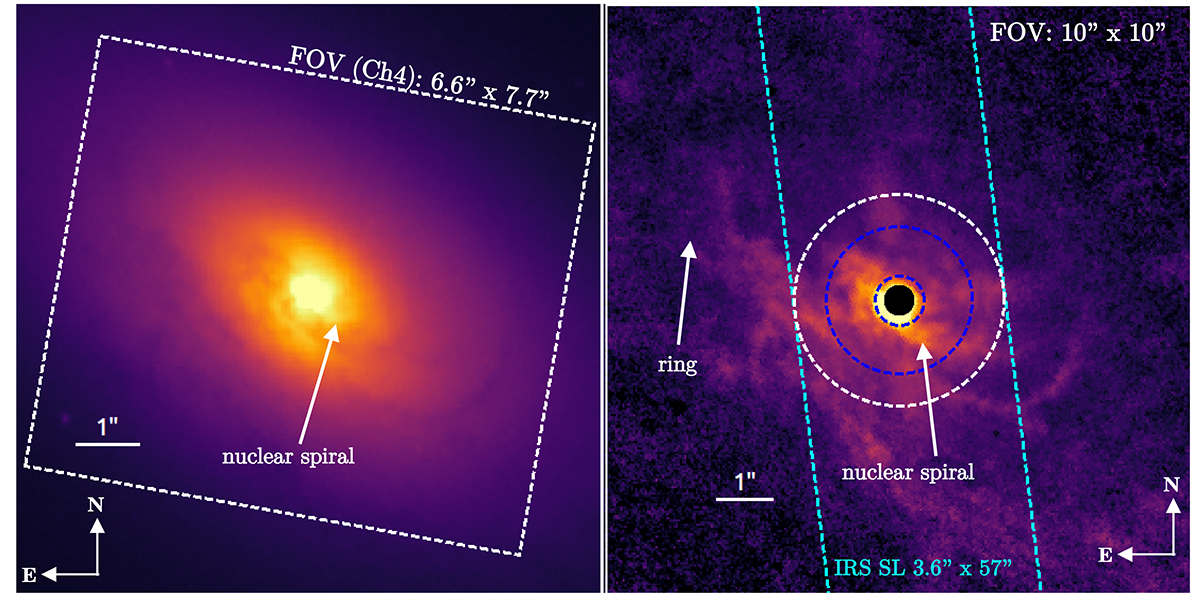
HST/WFC3 image and color map of MCG−05−23−16. Left: 10″ × 10″ image obtained using the filter F606W (λref ∼ 5889 Å). The JWST/MIRI/MRS FoV of Channel 4 (Ch4) is shown with a dashed white rectangle. The horizontal white line indicates the physical size of 1″. Right: V-H color map using the F606W (left panel) and F160W (λref ∼ 15 369 Å) images. The innermost region of the map has been masked using a solid black circle of 1.5 × FWHM of the F160W filter (1.5 × 0![]() 18) to avoid artifacts due to the mismatch between the different PSFs of F606W and F160W. The dashed blue circles correspond to the regions used to extract the JWST/MIRI nuclear spectrum considering the correction per aperture (Ch1-s: diameter of 0
18) to avoid artifacts due to the mismatch between the different PSFs of F606W and F160W. The dashed blue circles correspond to the regions used to extract the JWST/MIRI nuclear spectrum considering the correction per aperture (Ch1-s: diameter of 0![]() 8 ≃ 141 pc – Ch4-l: 2
8 ≃ 141 pc – Ch4-l: 2![]() 5 ≃ 440 pc). The dashed white circle corresponds to the region that extracts the extended (diameter of 3
5 ≃ 440 pc). The dashed white circle corresponds to the region that extracts the extended (diameter of 3![]() 6 ≃ 634 pc) JWST/MIRI spectrum. The nuclear and extended spectra are shown in Fig. 2 with solid orange and blue lines, respectively. The Spitzer/IRS SL (3
6 ≃ 634 pc) JWST/MIRI spectrum. The nuclear and extended spectra are shown in Fig. 2 with solid orange and blue lines, respectively. The Spitzer/IRS SL (3![]() 6 × 57″, PA = 187°) slit is shown with dashed cyan lines. A dust lane resembling a nuclear spiral can be seen southwest and northeast of the nucleus. See also Fig. A.1.
6 × 57″, PA = 187°) slit is shown with dashed cyan lines. A dust lane resembling a nuclear spiral can be seen southwest and northeast of the nucleus. See also Fig. A.1.
Current usage metrics show cumulative count of Article Views (full-text article views including HTML views, PDF and ePub downloads, according to the available data) and Abstracts Views on Vision4Press platform.
Data correspond to usage on the plateform after 2015. The current usage metrics is available 48-96 hours after online publication and is updated daily on week days.
Initial download of the metrics may take a while.