Fig. 8
Download original image
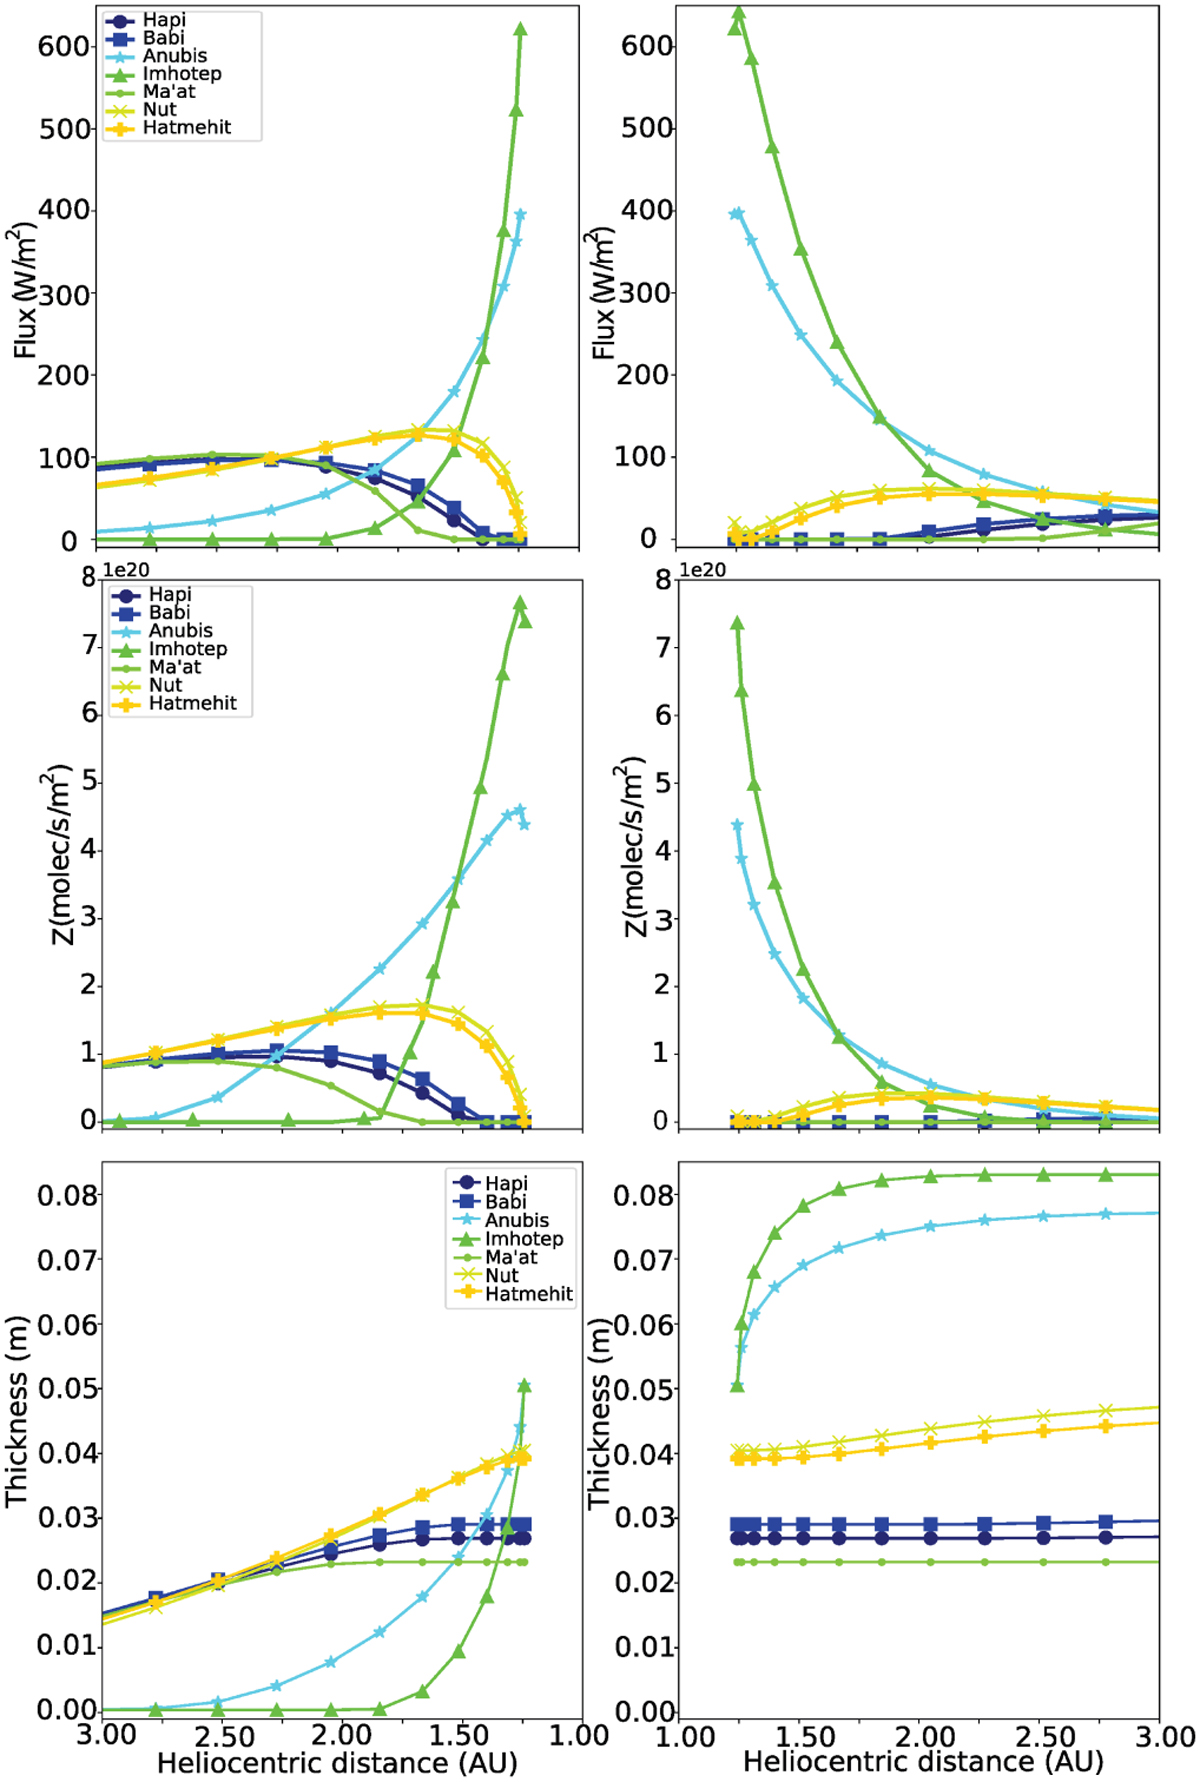
Heliocentric evolution of key physical model characteristics for the five selected facets on 67P/C-G; the solar flux (top), the gas production rate (middle), and the dust layer thickness (bottom) are shown as functions of heliocentric distance. The left and right columns represent pre- and post-perihelion branches, respectively.
Current usage metrics show cumulative count of Article Views (full-text article views including HTML views, PDF and ePub downloads, according to the available data) and Abstracts Views on Vision4Press platform.
Data correspond to usage on the plateform after 2015. The current usage metrics is available 48-96 hours after online publication and is updated daily on week days.
Initial download of the metrics may take a while.