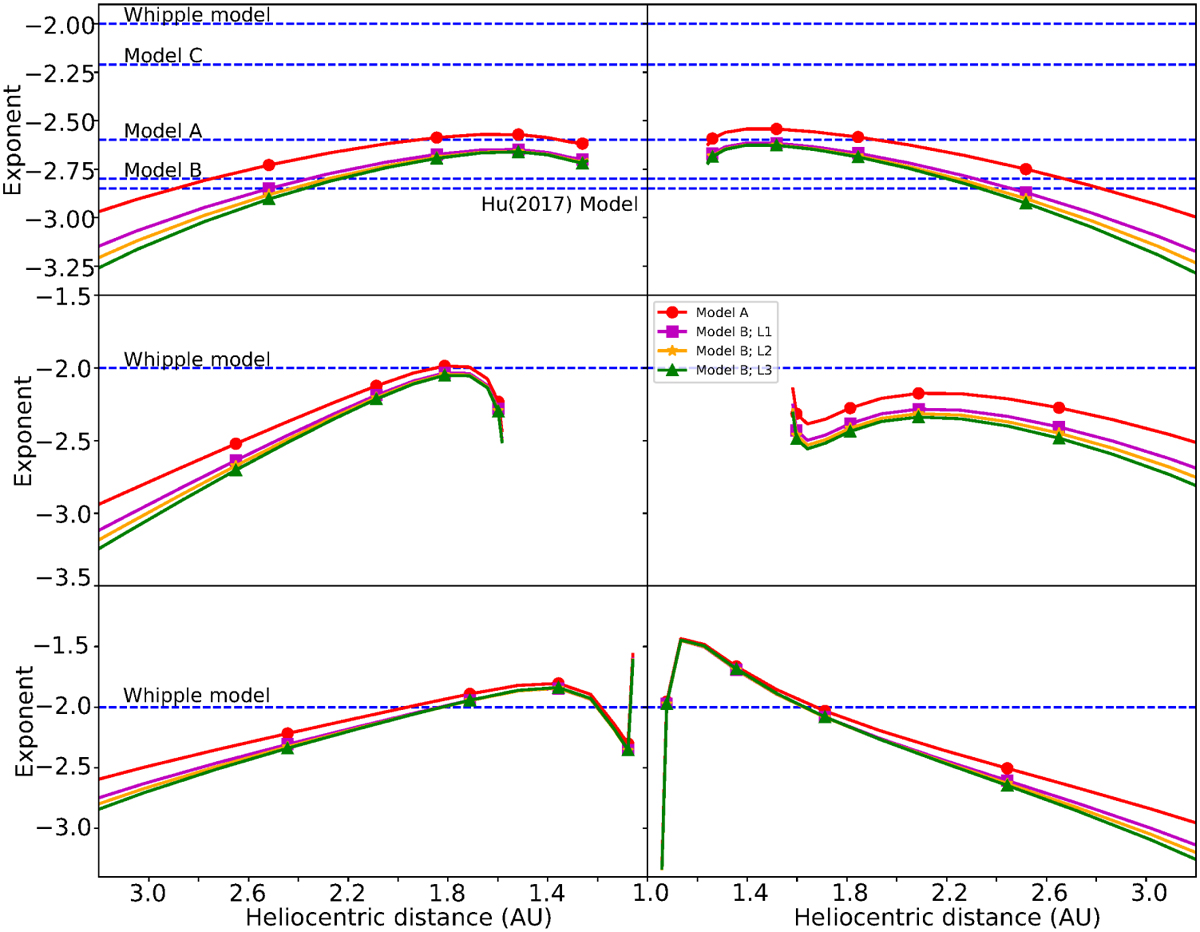
Fig. C.1
Download original image
Exponent for the power functions approximating the total gas production of 67P/C-G, 81P/Wild 2, and 103P/Hartley 2 (from top to bottom) as a function of heliocentric distance. L1, L2, and L3 represent the thicknesses of the dust layer in Model B, composed of dust particles with a size of 10−4 m. The left and right columns correspond to pre- and post-perihelion conditions, respectively.
Current usage metrics show cumulative count of Article Views (full-text article views including HTML views, PDF and ePub downloads, according to the available data) and Abstracts Views on Vision4Press platform.
Data correspond to usage on the plateform after 2015. The current usage metrics is available 48-96 hours after online publication and is updated daily on week days.
Initial download of the metrics may take a while.