Open Access
Fig. 8.
Download original image
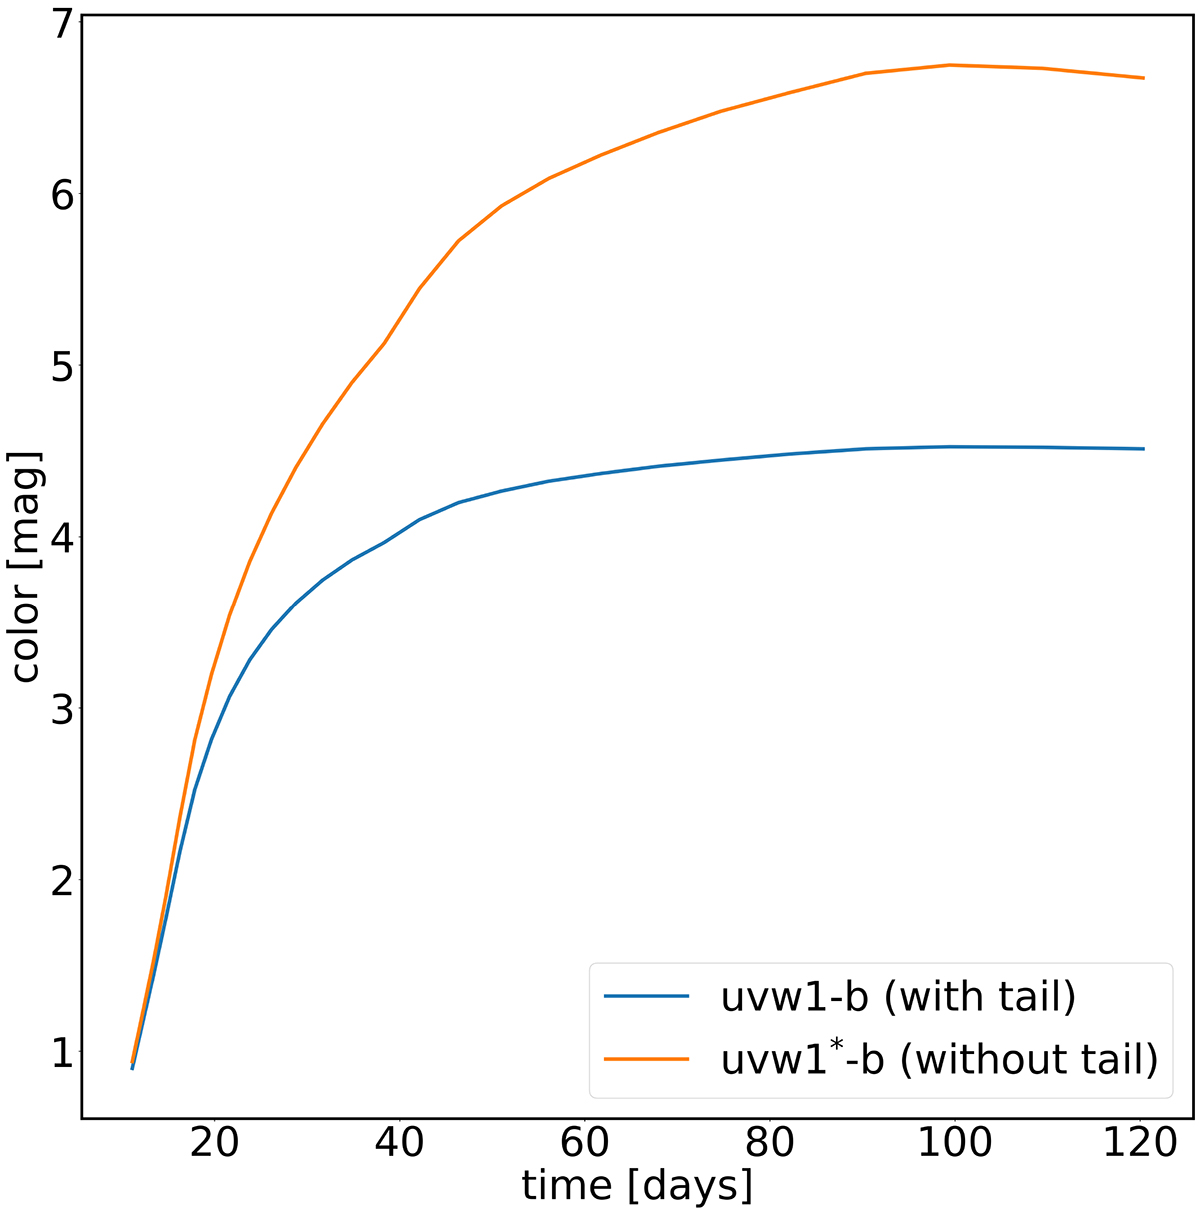
Color curves uvw1 − b (blue) and uvw1* − b (orange) created with the Dessart et al. (2013) model spectra using the SWIFT filters uvw1, b, and the modified uvw1*, where the red tail has been cut. The color curve uvw1* − b still shows a sufficiently strong kink for our time delay method to work.
Current usage metrics show cumulative count of Article Views (full-text article views including HTML views, PDF and ePub downloads, according to the available data) and Abstracts Views on Vision4Press platform.
Data correspond to usage on the plateform after 2015. The current usage metrics is available 48-96 hours after online publication and is updated daily on week days.
Initial download of the metrics may take a while.