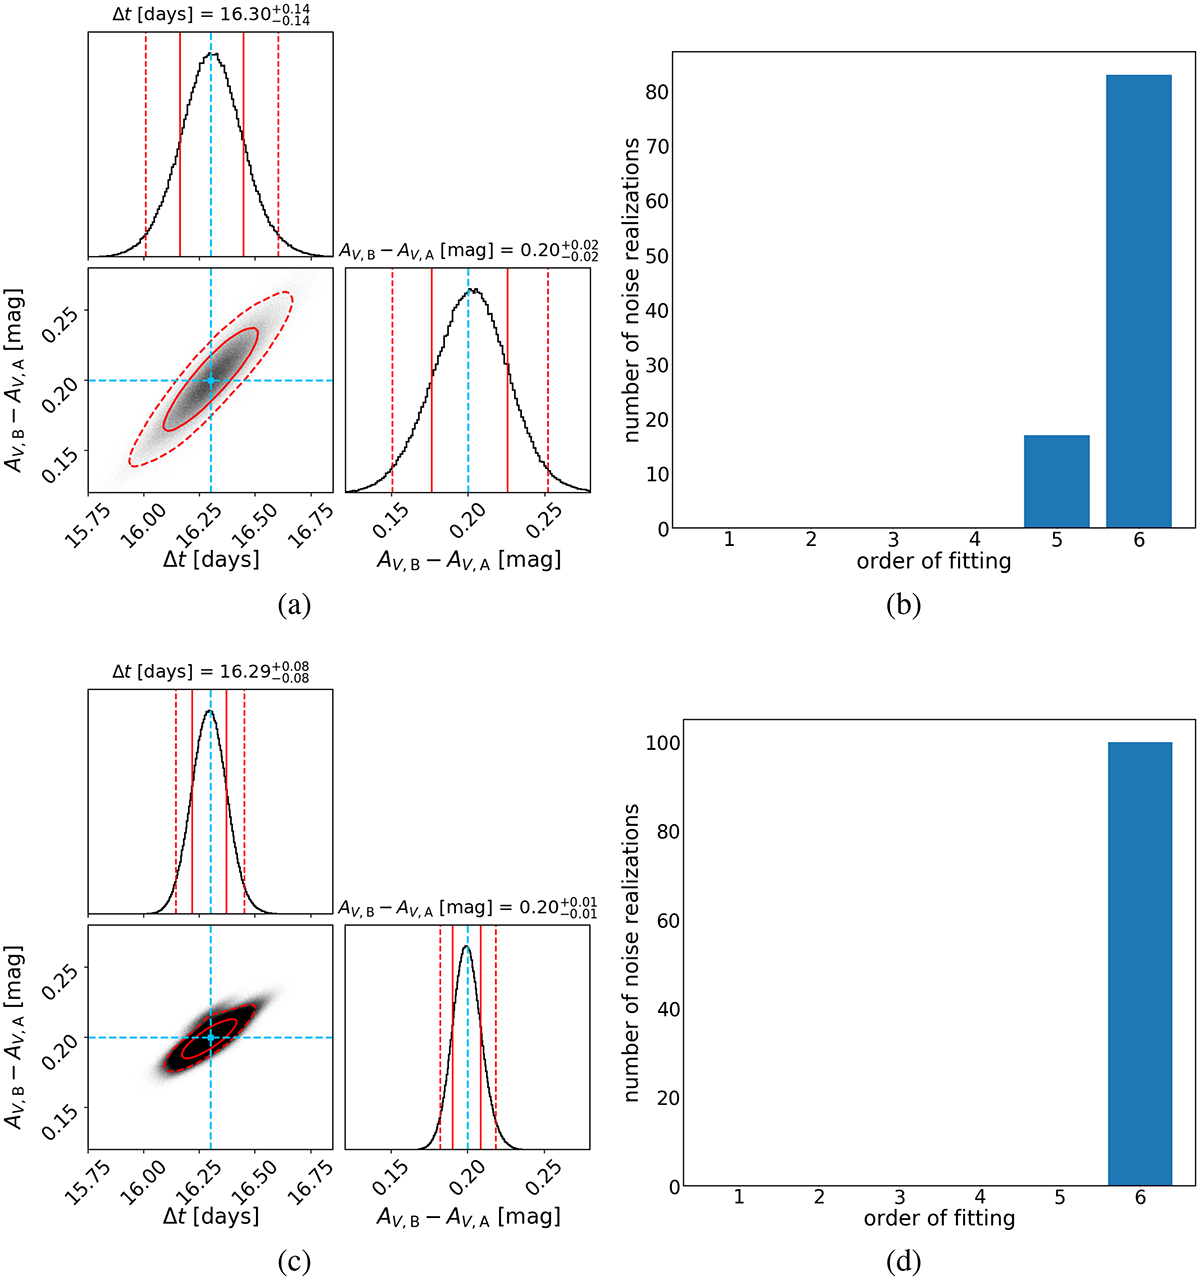
Fig. 3.
Download original image
Corner plots of the MCMC chain results and bar plots of selected orders for 100 noise realizations for case 1. The left panels show corner plots of the time shift and differential dust extinction retrieved from 100 noise realizations for case 1. We plot the contours for the 1σ (68%, solid red line) and 2σ (95%, dashed red line) credible intervals for the differential dust extinction AV, B − AV, A and the time delay Δt. The input values in light blue are Δt = 16.3 days and AV, B − AV, A = 0.2 mag. On the right, we show histograms of the selected orthogonal polynomial orders of fitting using the BIC for the corresponding cases on the left. Panel a: Case 1 with one color curve u − g. Panel b: Orders of fitting selected for case 1 with one color curve u − g. Panel c: Case 1 with two color curves u − g and u − r. Panel d: Orders of fitting selected for case 1 with two color curves u − g and u − r. We impose the same order for both color curves.
Current usage metrics show cumulative count of Article Views (full-text article views including HTML views, PDF and ePub downloads, according to the available data) and Abstracts Views on Vision4Press platform.
Data correspond to usage on the plateform after 2015. The current usage metrics is available 48-96 hours after online publication and is updated daily on week days.
Initial download of the metrics may take a while.