Fig. 13.
Download original image
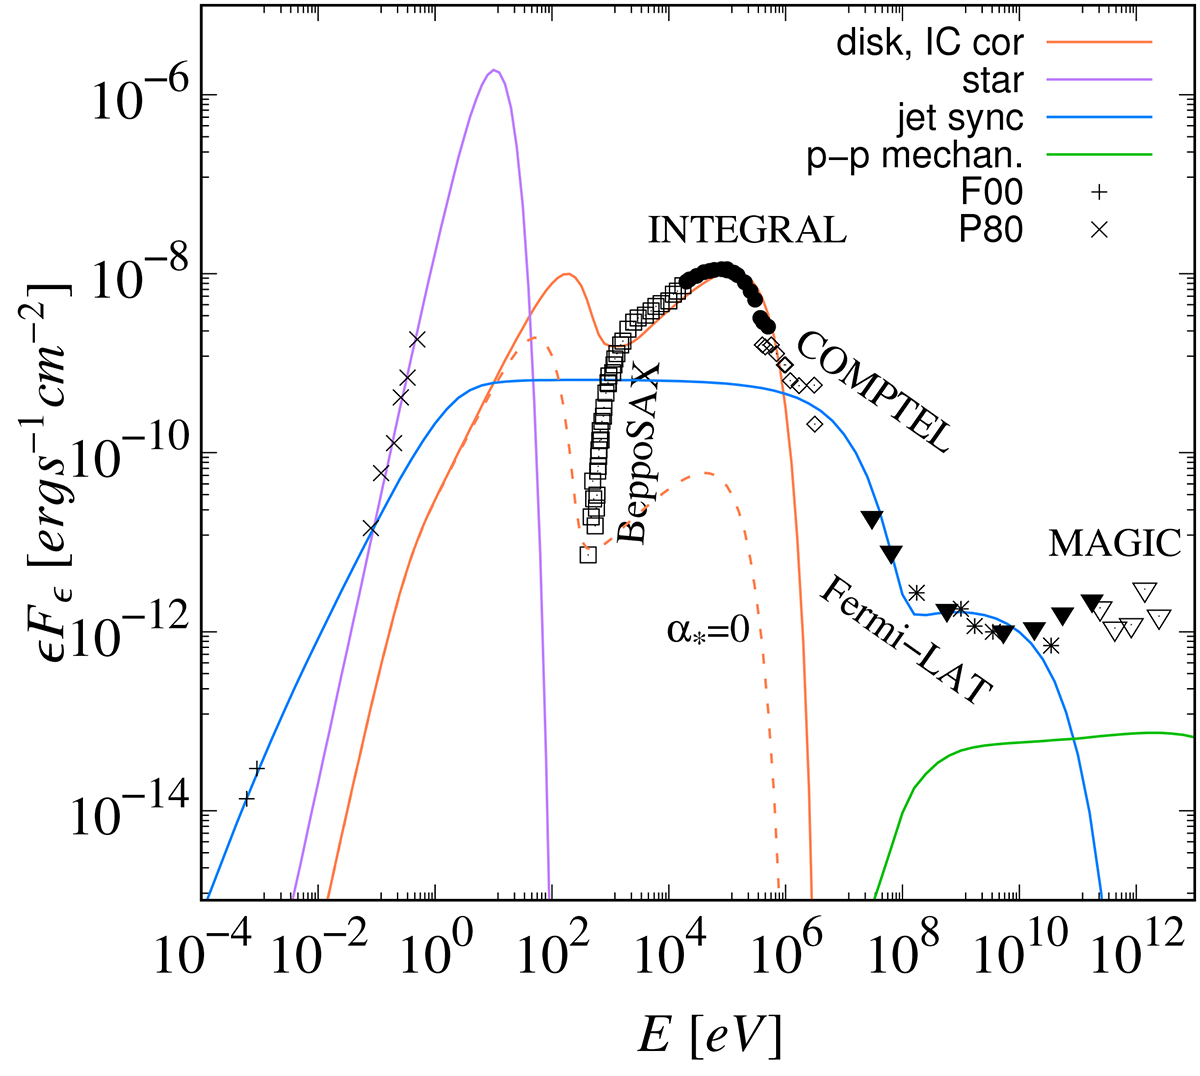
Spectral energy distribution associated with the hard/low state of Cygnus X-1. The plotted observational data include the IR and radio emission points up to 1 eV Persi et al. (1980) as P80, Fender et al. (2000) as F00), the soft and hard X-ray emission detected by BeppoSAX and INTEGRAL (Di Salvo et al. 2001; Zdziarski et al. 2012), and the gamma-ray measurements and upper limits by COMPTEL, Fermi-LAT, and MAGIC (McConnell et al. 2002; Malyshev et al. 2013; Ahnen et al. 2017).
Current usage metrics show cumulative count of Article Views (full-text article views including HTML views, PDF and ePub downloads, according to the available data) and Abstracts Views on Vision4Press platform.
Data correspond to usage on the plateform after 2015. The current usage metrics is available 48-96 hours after online publication and is updated daily on week days.
Initial download of the metrics may take a while.