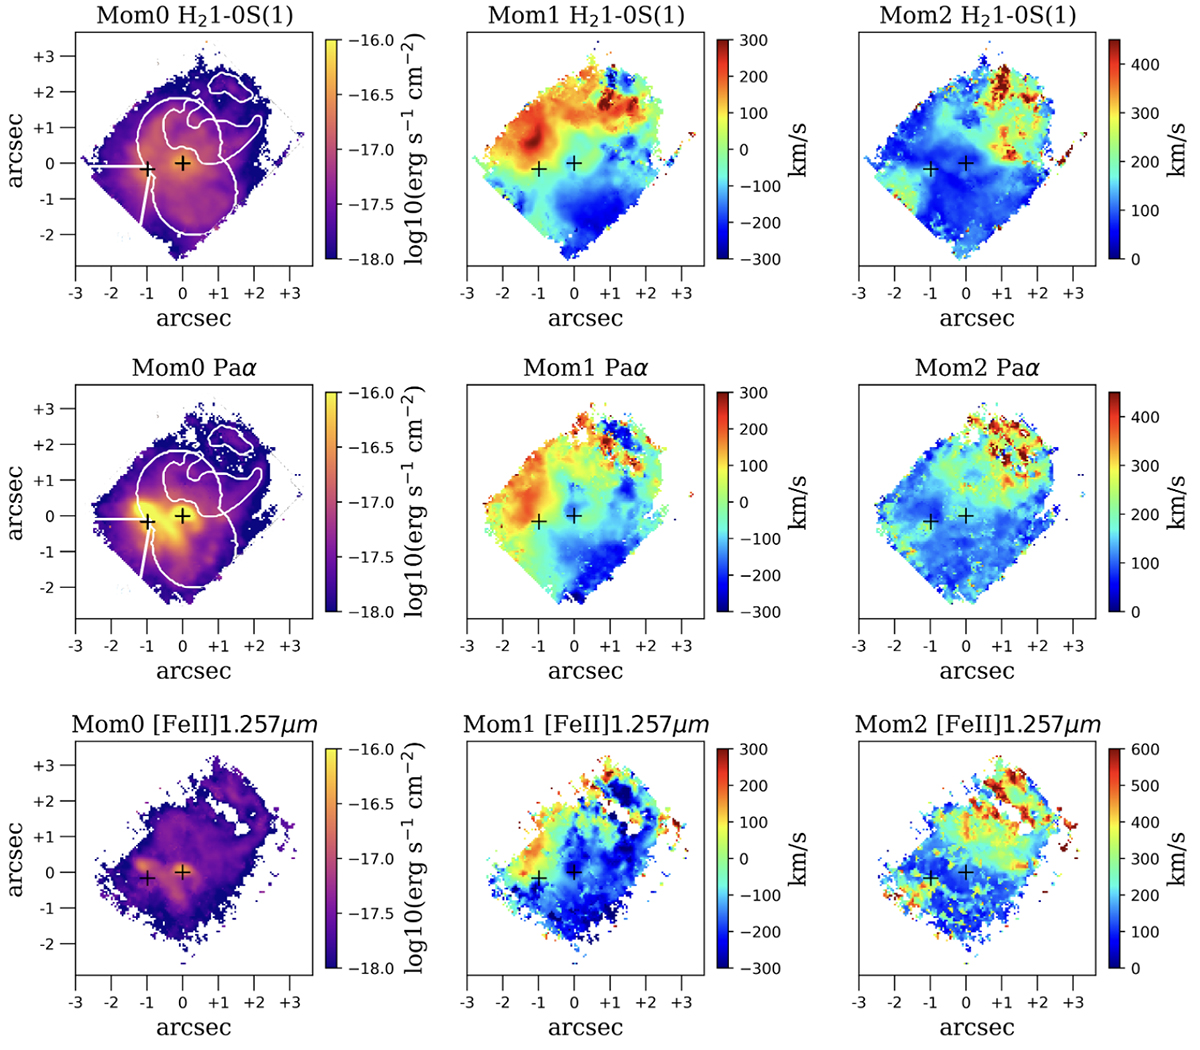
Fig. 4.
Download original image
Moment maps of hot molecular gas (H2 1-0S(1), top) and ionized gas (center: Paα, bottom: [Fe II] 1.257 μm). The moment-1 was computed with respect to zm = 0.0181. An S/N cut of three on the flux of each emission line was applied to the maps. The black “+” symbols mark the position of the E and W nuclei. White contours represent the edges of the masks described in Sect. 4.
Current usage metrics show cumulative count of Article Views (full-text article views including HTML views, PDF and ePub downloads, according to the available data) and Abstracts Views on Vision4Press platform.
Data correspond to usage on the plateform after 2015. The current usage metrics is available 48-96 hours after online publication and is updated daily on week days.
Initial download of the metrics may take a while.