Open Access
Fig. 10
Download original image
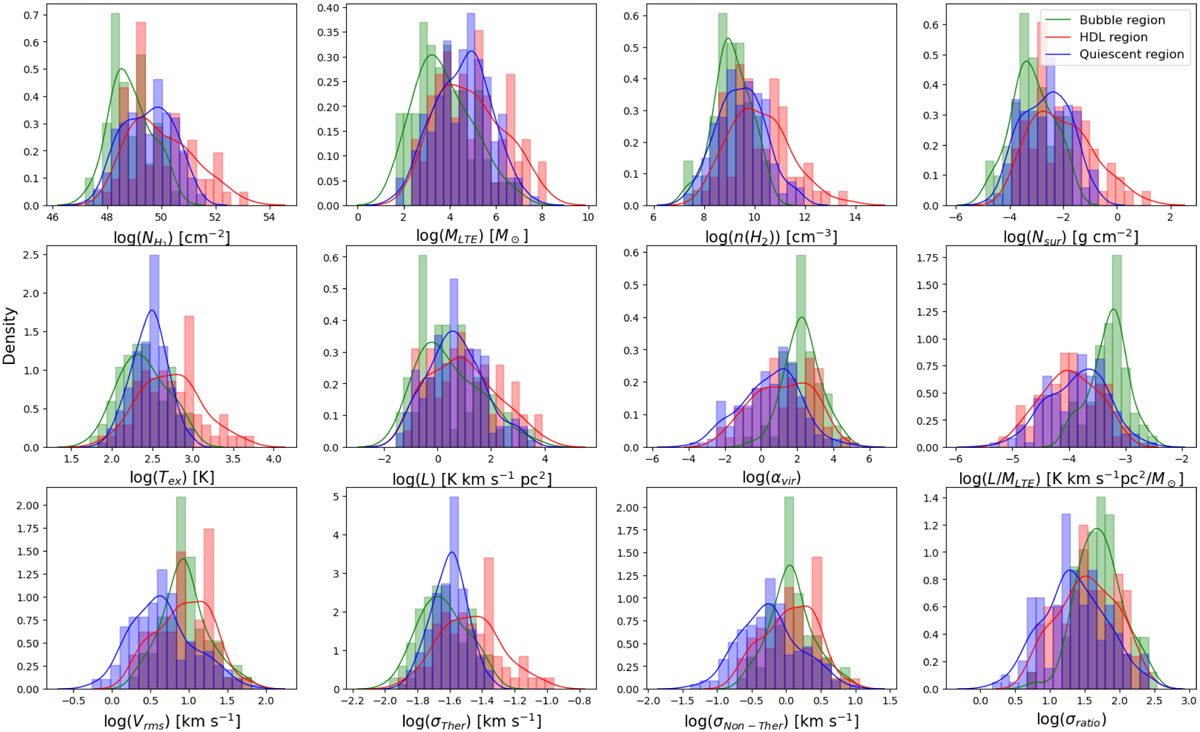
Comparison of clump parameters of bubbles (green), HDLs (red) and quiescent clumps (blue) in the W3/4 complex. The solid lines overlaid in matching colors show the kernel density estimate (KDE) of the distribution of the corresponding properties.
Current usage metrics show cumulative count of Article Views (full-text article views including HTML views, PDF and ePub downloads, according to the available data) and Abstracts Views on Vision4Press platform.
Data correspond to usage on the plateform after 2015. The current usage metrics is available 48-96 hours after online publication and is updated daily on week days.
Initial download of the metrics may take a while.