Fig. 5
Download original image
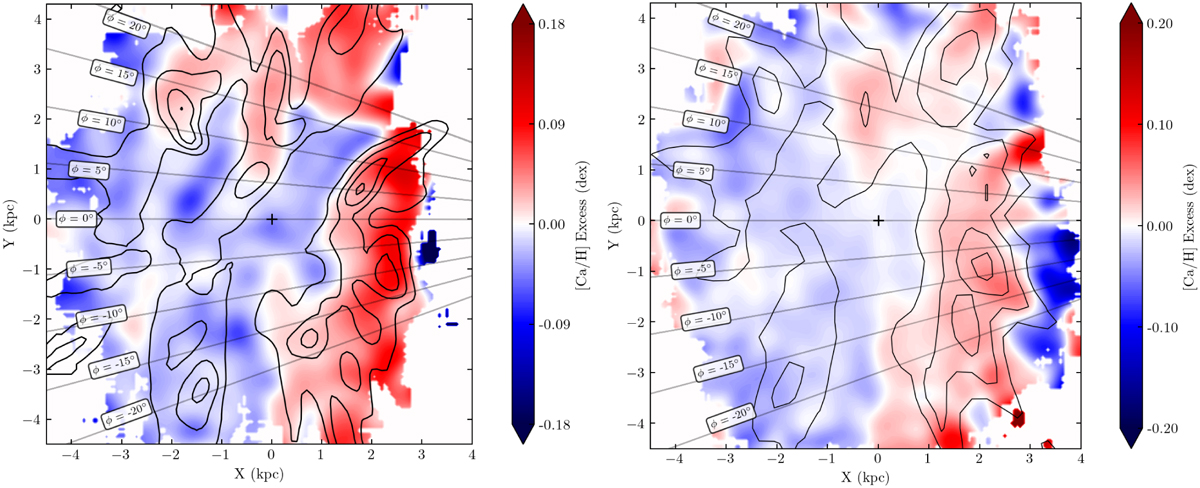
[C/H] chemical inhomogeneities in the Galactic disc for samples A and C. Left panel: map of [Ca/H] excess for sample A, including the spiral arm contours from Poggio et al. (2021) adopting the same local bandwidth as for [Ca/Fe]. Right panel: same for sample C, including the spiral arm contours from Palicio et al. (2023) adopting the same local bandwidth as for [Ca/Fe].
Current usage metrics show cumulative count of Article Views (full-text article views including HTML views, PDF and ePub downloads, according to the available data) and Abstracts Views on Vision4Press platform.
Data correspond to usage on the plateform after 2015. The current usage metrics is available 48-96 hours after online publication and is updated daily on week days.
Initial download of the metrics may take a while.