Fig. A.2
Download original image
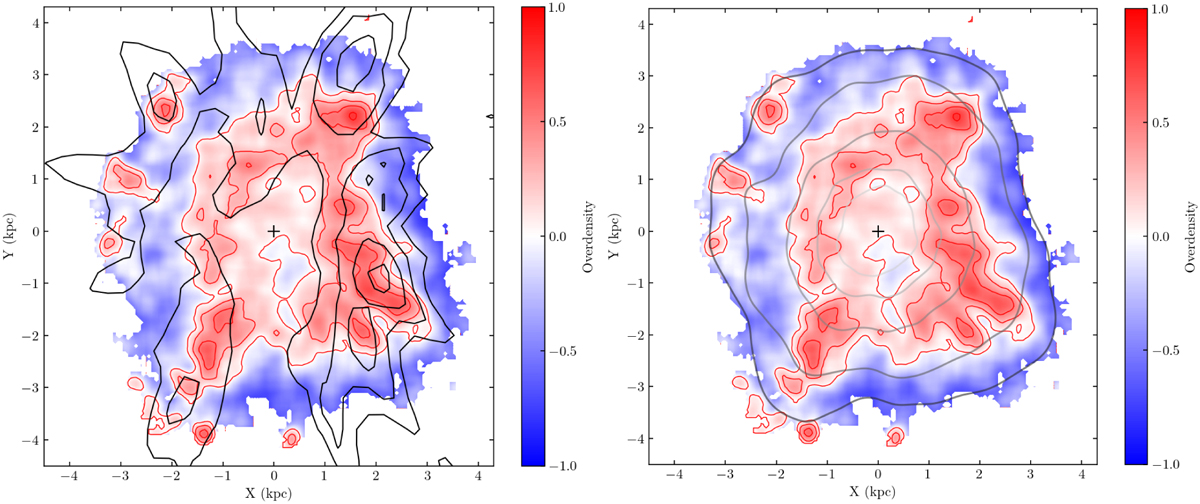
Correlation between the sample C overdensity and the segments of Palicio et al. (2023) spiral arms in the Galactic disc. Left panel: Overdensity map of sample C with Vϕ ≤ 210 km/s. Here, 13566 stars are considered. The black contours indicate the position of the spiral arms obtained using the sample of giant stars (Palicio et al. 2023). The position of the Sun is indicated by the black cross at (X, Y) = (0, 0) kpc. Right panel: Identical to the left panel, with grey circular outlines that include stars with G ≤ 9, 10, 11, 12 and 13 mag (for the tightest to widest circles).
Current usage metrics show cumulative count of Article Views (full-text article views including HTML views, PDF and ePub downloads, according to the available data) and Abstracts Views on Vision4Press platform.
Data correspond to usage on the plateform after 2015. The current usage metrics is available 48-96 hours after online publication and is updated daily on week days.
Initial download of the metrics may take a while.