Fig. A.1
Download original image
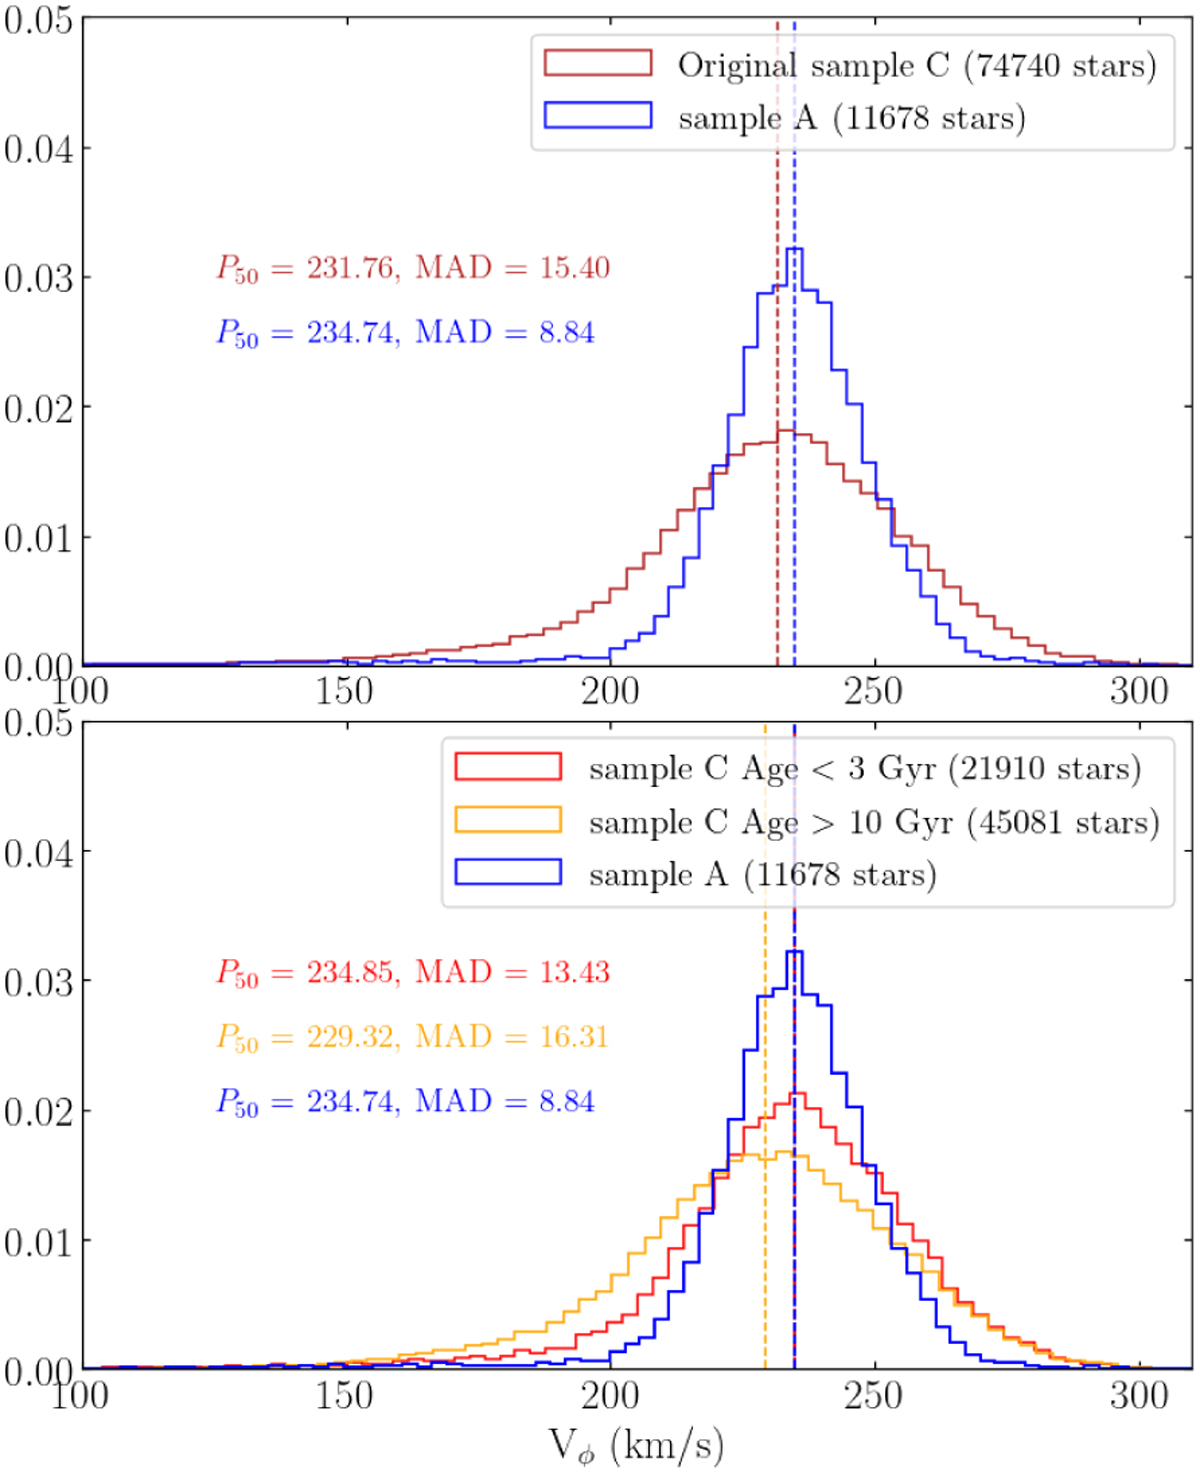
Distribution of Galactic azimuthal velocities Vϕ for samples A and C. Upper panel: Probability distribution function of Vϕ for sample A and original sample C of this study, normalised to set the area equal to 1. The dark red bars show the stars distribution of sample C, while blue bars show sample A, displayed with median values (P50) and median absolute deviations (MAD) in km/s. Vertical dashed lines denote the median values for each sample. Bottom panel: Same as the upper panel considering sample A and subsets of sample C. The red and orange bars show the stars distribution of sample C for sources below 3 Gyr and over 10 Gyr, respectively, to avoid contribution from stars in each subset.
Current usage metrics show cumulative count of Article Views (full-text article views including HTML views, PDF and ePub downloads, according to the available data) and Abstracts Views on Vision4Press platform.
Data correspond to usage on the plateform after 2015. The current usage metrics is available 48-96 hours after online publication and is updated daily on week days.
Initial download of the metrics may take a while.