Fig. 10
Download original image
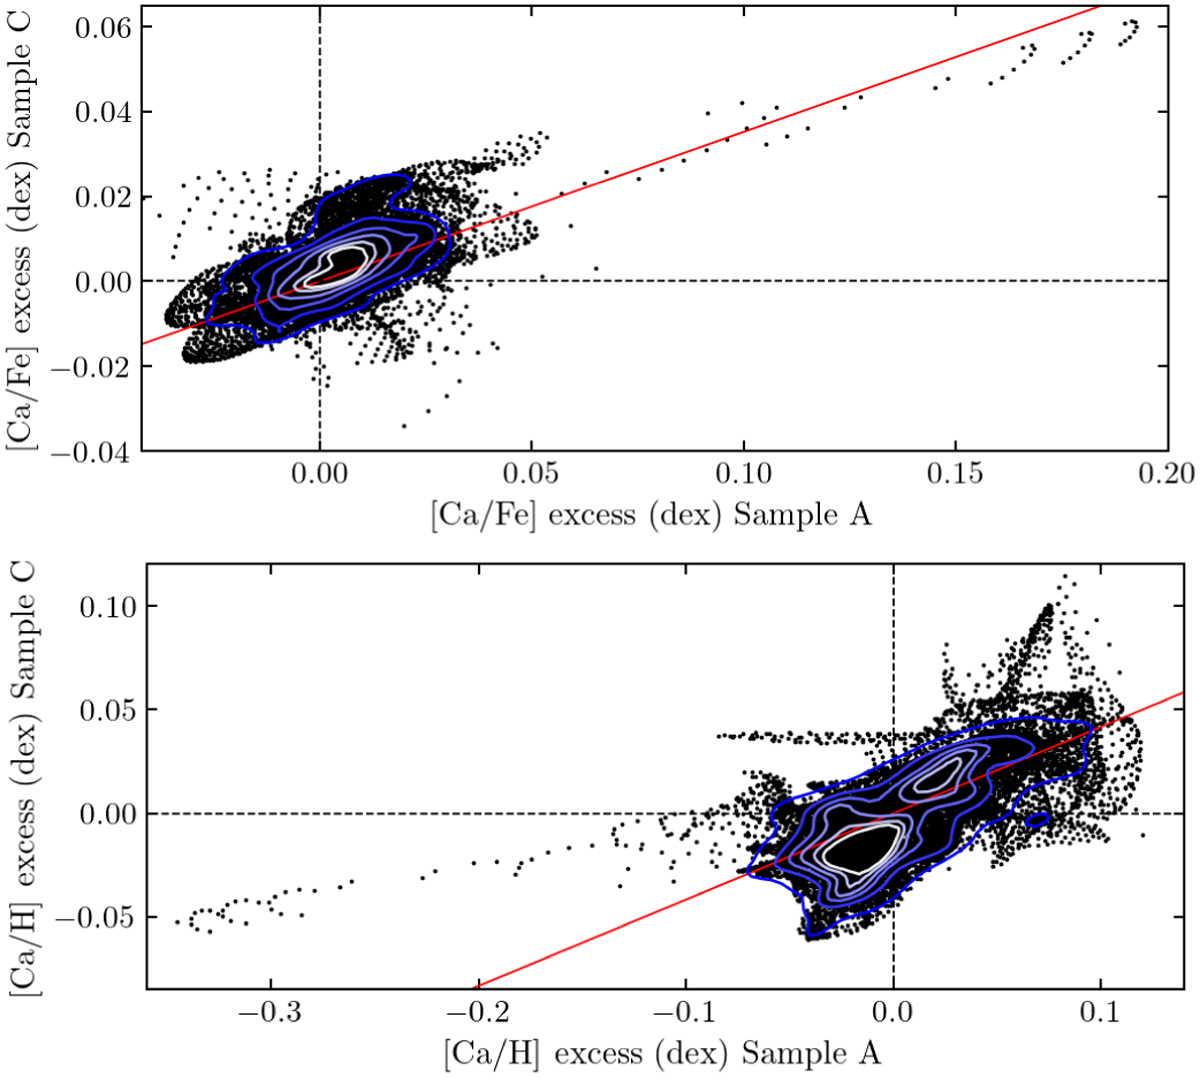
Correlations in the [Ca/Fe] and [Ca/H] excess distributions of the Galactic disc for samples A and C. Upper panel: pixel-to-pixel (black dots) diagram showing the [Ca/Fe] excess variation in sample C as a function of sample A. The blue contours show the distribution of the [Ca/Fe] excess of sample C vs. that of sample A and encloses fractions of 90, 75, 60, 45, 30, and 20% of the total number of pixels. The red line shows a linear fit to the black dots. Bottom panel: same as the upper panel for the [Ca/H] excess case.
Current usage metrics show cumulative count of Article Views (full-text article views including HTML views, PDF and ePub downloads, according to the available data) and Abstracts Views on Vision4Press platform.
Data correspond to usage on the plateform after 2015. The current usage metrics is available 48-96 hours after online publication and is updated daily on week days.
Initial download of the metrics may take a while.