Fig. 1
Download original image
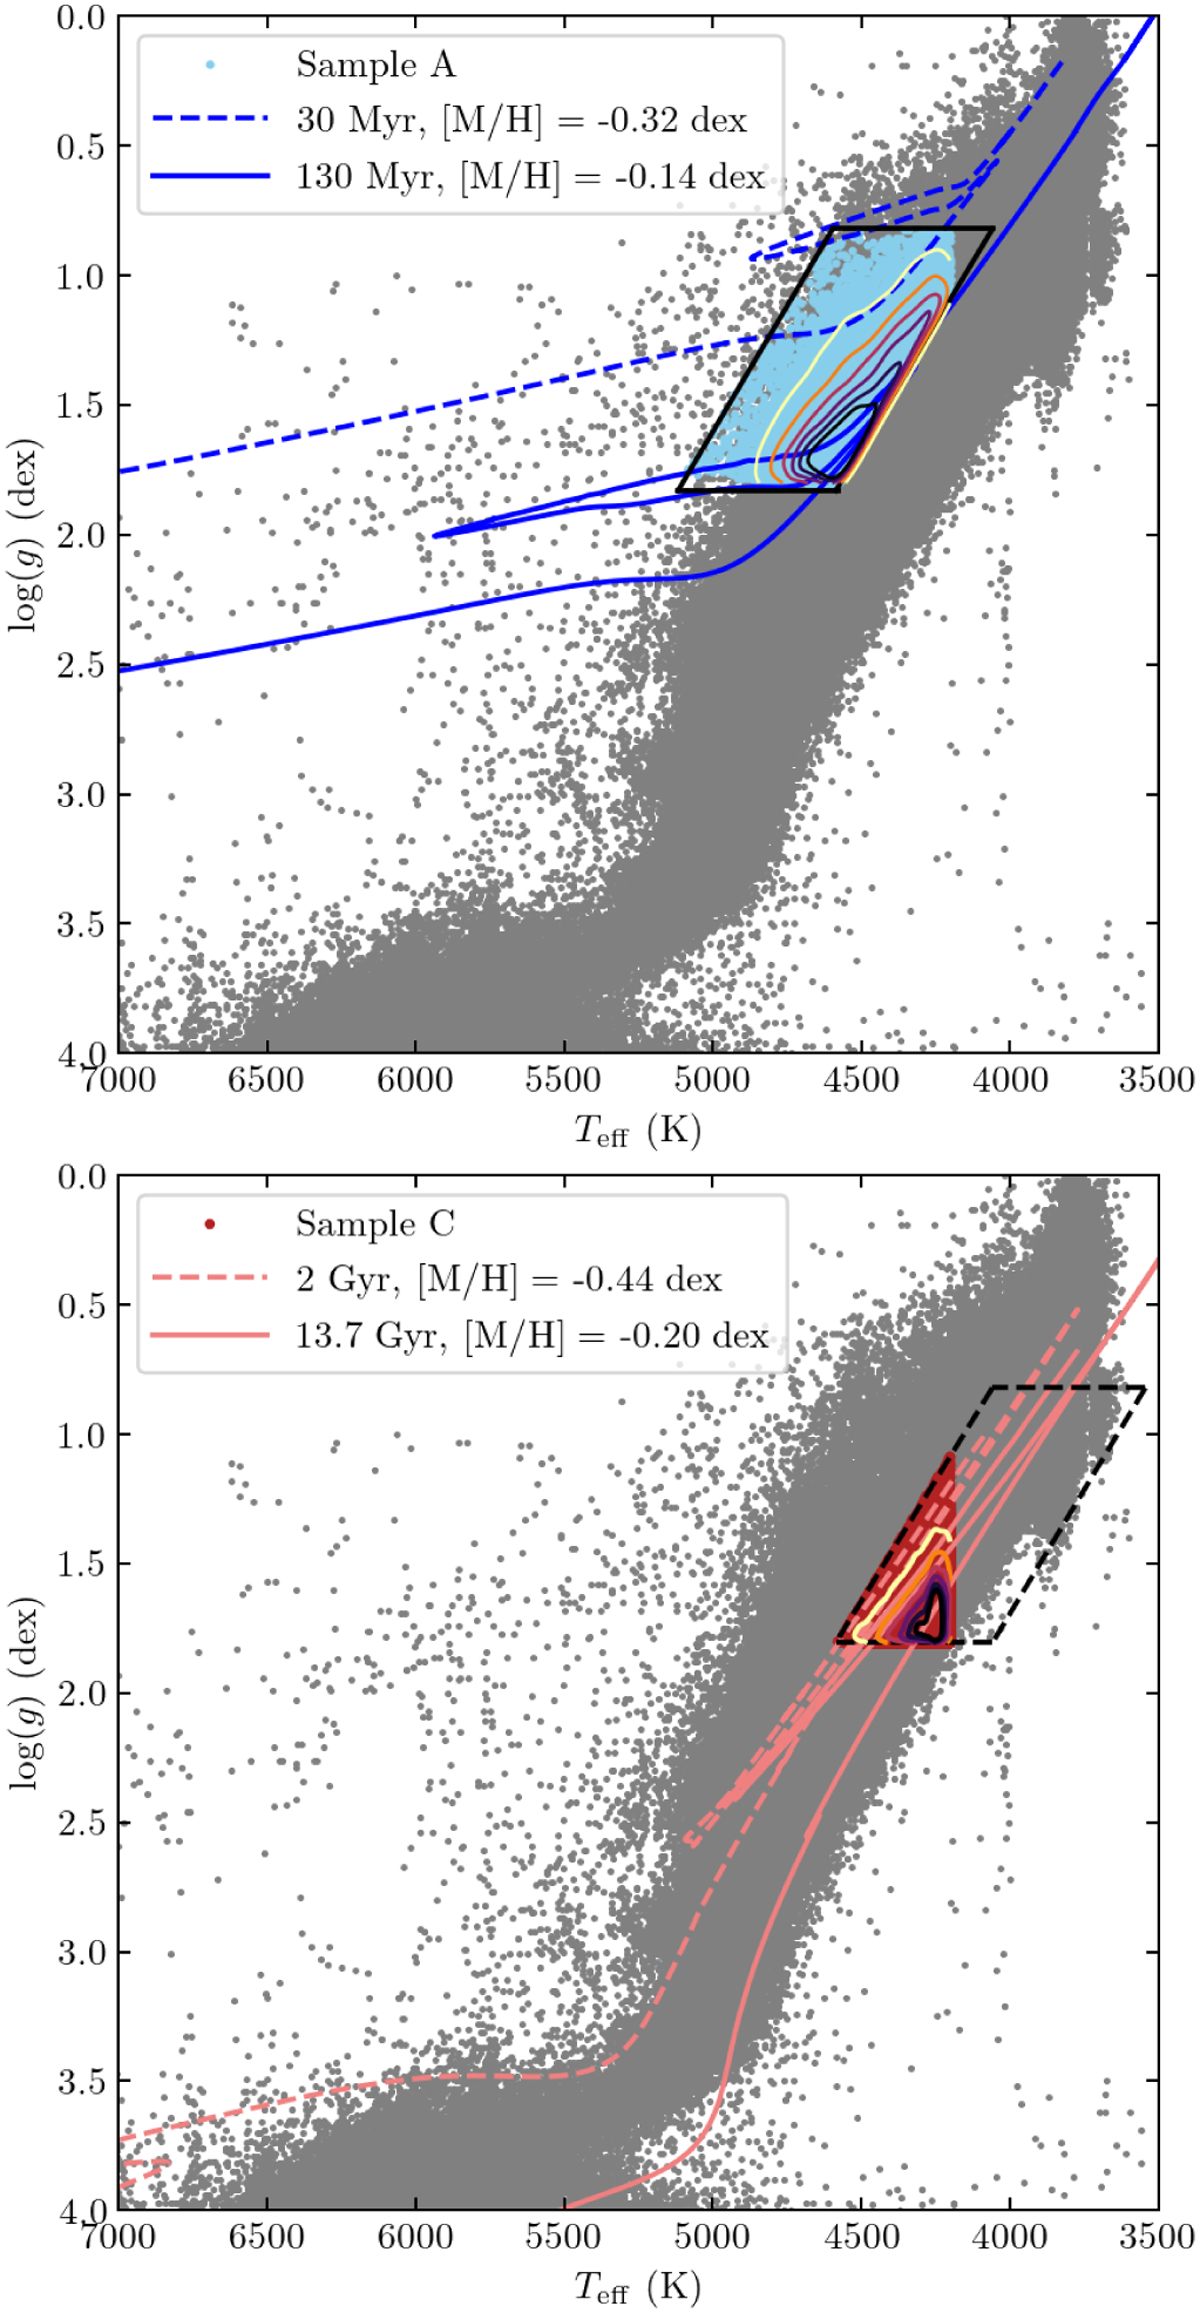
Kiel diagram of the selected samples A and C of bright giant stars. Upper panel: selection of sample A targets (blue dots) in the Kiel diagram using the selection criteria of the calcium query (cf. Appendix A). The box with solid lines shows the initial sample A before we applied the cut-off in Teff. As a visual reference, the grey points represent the MW population from the initial selection (including all stellar types from the GSP-Spec catalogue). We overplot isochrones based on BaSTI stellar evolution models and density contours of the stellar distribution with contour lines enclosing fractions of 90, 75, 60, 45, 30 and 20% of the total number of stars. Lower panel: same, but showing the sample C selection (red dots). The box with dashed lines shows the initial sample C before we applied the cut in Teff.
Current usage metrics show cumulative count of Article Views (full-text article views including HTML views, PDF and ePub downloads, according to the available data) and Abstracts Views on Vision4Press platform.
Data correspond to usage on the plateform after 2015. The current usage metrics is available 48-96 hours after online publication and is updated daily on week days.
Initial download of the metrics may take a while.