Open Access
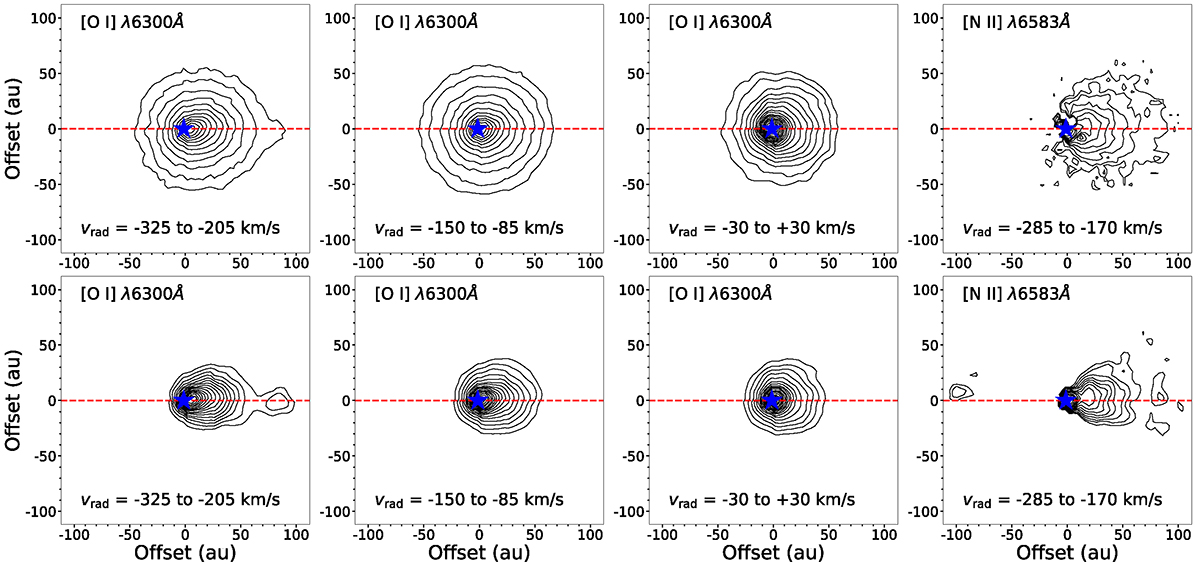
Fig. C.1.
Download original image
Comparing the channel maps of the jet, HVC1 and NC in [O I] λ6300 emission, and the jet in [N II] λ6583 emission, before (top panels) and after (bottom panels) deconvolution. The source position is marked with a blue star. The contour levels begin at 3σ of the background emission and increase by factors of 1.5.
Current usage metrics show cumulative count of Article Views (full-text article views including HTML views, PDF and ePub downloads, according to the available data) and Abstracts Views on Vision4Press platform.
Data correspond to usage on the plateform after 2015. The current usage metrics is available 48-96 hours after online publication and is updated daily on week days.
Initial download of the metrics may take a while.