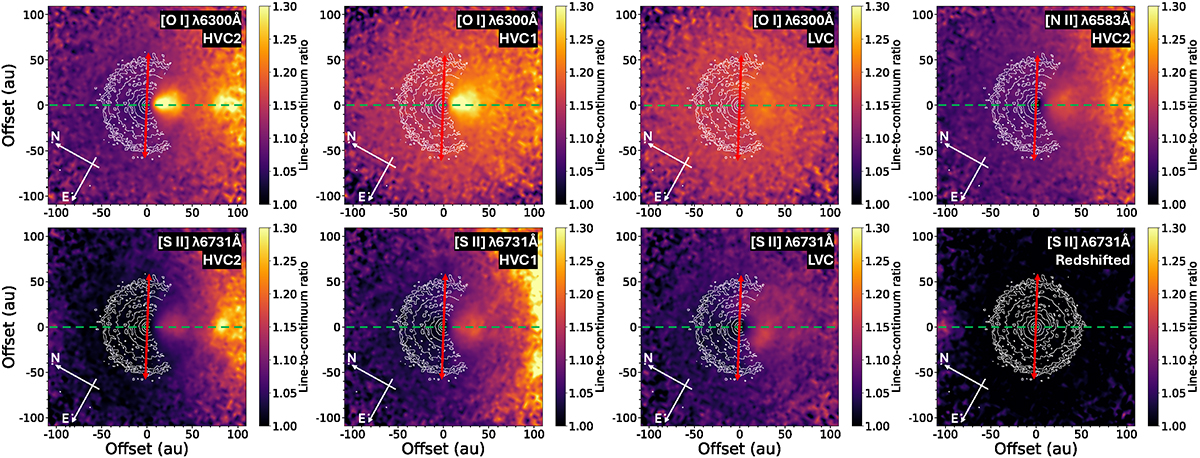
Fig. B.1.
Download original image
Line to continuum ratio maps of the [O I] λ6300, [S II] λ6731 and [N II] λ6583 channel maps shown in Figs. C.1 and C.2, before continuum subtraction and deconvolution. A sector of the ALMA 1.3 mm dust continuum disk image is shown in white contours. Intrinsic line emission appears bright in these images, whereas scattered light is represented by a constant ratio close to unity. The red arrow delineates the disk PA and radius from Huang et al. (2018) (121° ± 5°, 63 ± 1 au) and the green dashed line represents the jet PA measured here (213° ± 2°).
Current usage metrics show cumulative count of Article Views (full-text article views including HTML views, PDF and ePub downloads, according to the available data) and Abstracts Views on Vision4Press platform.
Data correspond to usage on the plateform after 2015. The current usage metrics is available 48-96 hours after online publication and is updated daily on week days.
Initial download of the metrics may take a while.