Fig. 2.
Download original image
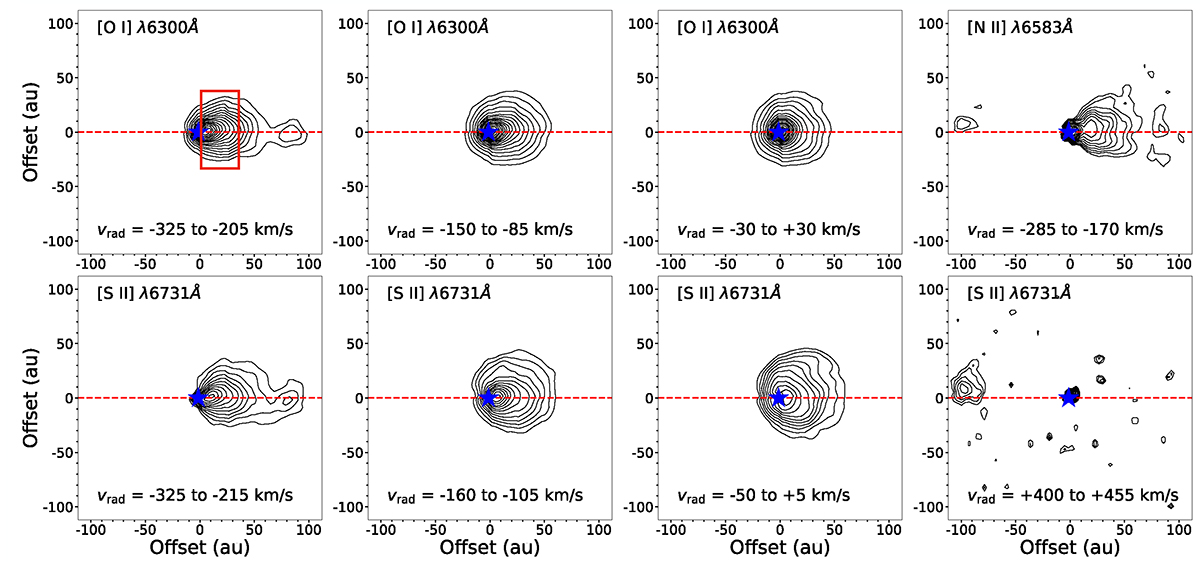
Deconvolved channel maps of the jet, HVC1, and NC emission from RU Lupi in the [O I] λ6300, [S II] λ6731 and [N II] λ6583 emission lines. The distances are not deprojected, and the red box shows the region for which the outflow widths are mapped (Fig. 3). The source position is marked with a blue star. The contour levels begin at 3σ of the background emission and increase by factors of 1.5.
Current usage metrics show cumulative count of Article Views (full-text article views including HTML views, PDF and ePub downloads, according to the available data) and Abstracts Views on Vision4Press platform.
Data correspond to usage on the plateform after 2015. The current usage metrics is available 48-96 hours after online publication and is updated daily on week days.
Initial download of the metrics may take a while.