Fig. D.2.
Download original image
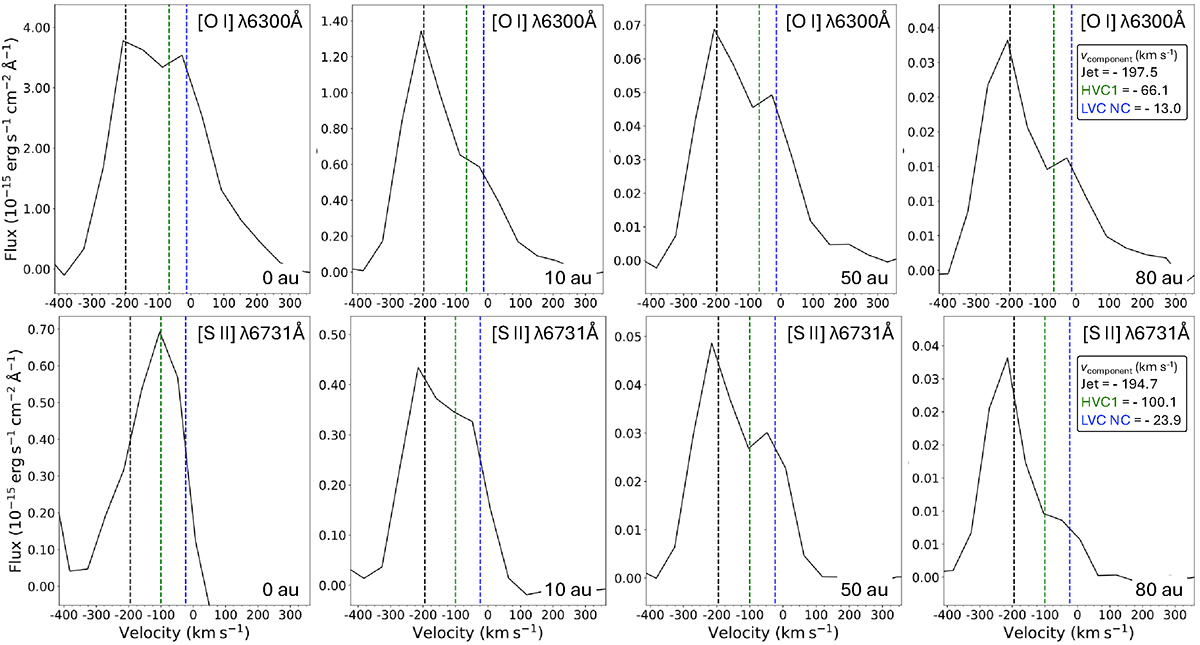
Line profiles extracted along the 0 au offset position (red dashed line) from the position velocity diagrams made transverse to the outflow axis, shown in Fig. D.1, for the [O I] λ6300 and [S II] λ6731 emission line regions. These PV slices were extracted at the source position, and at distances of 10 au, 50 au and 80 au from the star. Distances are not deprojected and these positions correspond to 29 au, 145 au and 232 au when corrected for the inclination of the system. The velocities of the jet, HVC1 and NC as measured by Whelan et al. (2021) are marked by the dashed lines. The line flux decreases as the offset from the central source increases. The NC appears as a clear secondary component distinct from the jet.
Current usage metrics show cumulative count of Article Views (full-text article views including HTML views, PDF and ePub downloads, according to the available data) and Abstracts Views on Vision4Press platform.
Data correspond to usage on the plateform after 2015. The current usage metrics is available 48-96 hours after online publication and is updated daily on week days.
Initial download of the metrics may take a while.