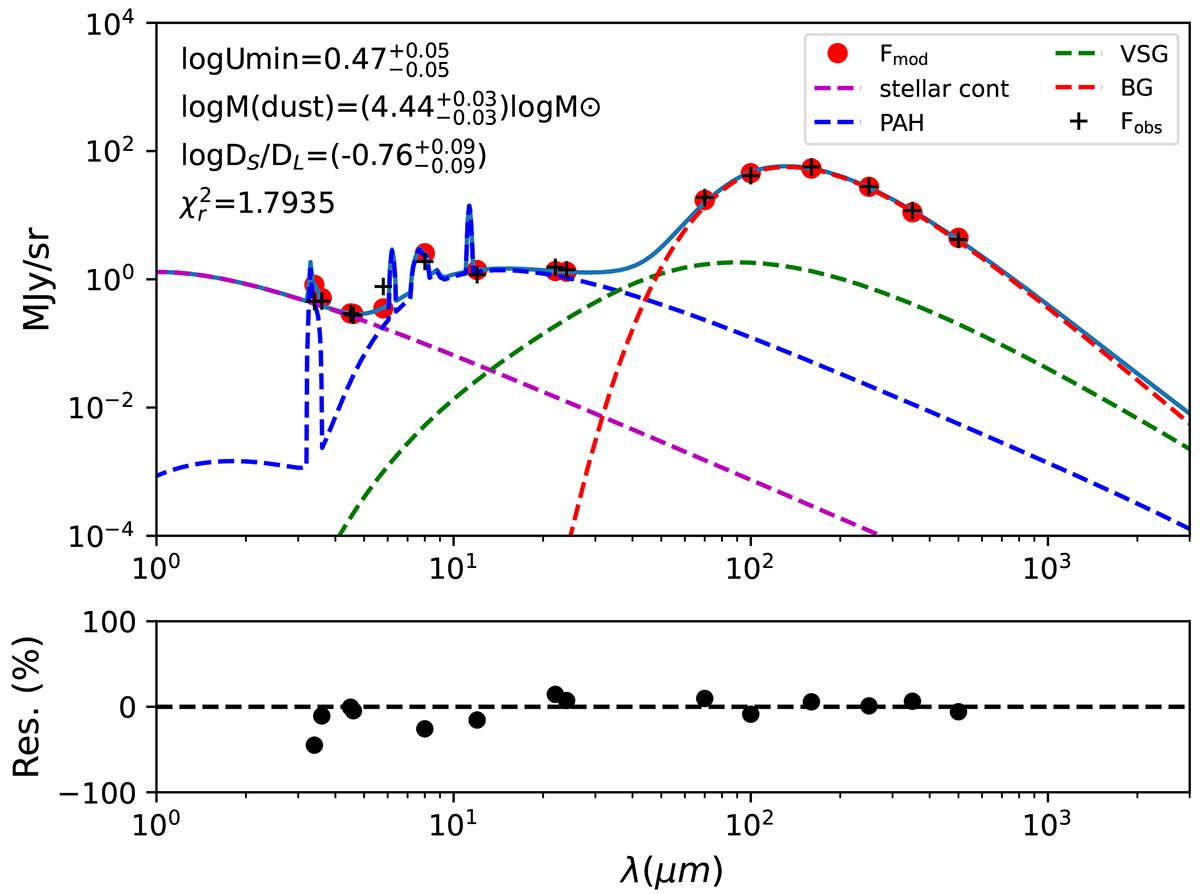
Fig. 2.
Download original image
Example SED fitting in the disk of NGC 628. The black crosses and red circles correspond to the observed and modeled fluxes, respectively. The purple dashed line represents a black body emission to account for the old stellar population, while the blue, green, and red dashed lines show the emission of the PAHs, VSGs, and BGs, respectively. The blue continuous line is the total emission. The panel below presents the residuals of the fit.
Current usage metrics show cumulative count of Article Views (full-text article views including HTML views, PDF and ePub downloads, according to the available data) and Abstracts Views on Vision4Press platform.
Data correspond to usage on the plateform after 2015. The current usage metrics is available 48-96 hours after online publication and is updated daily on week days.
Initial download of the metrics may take a while.