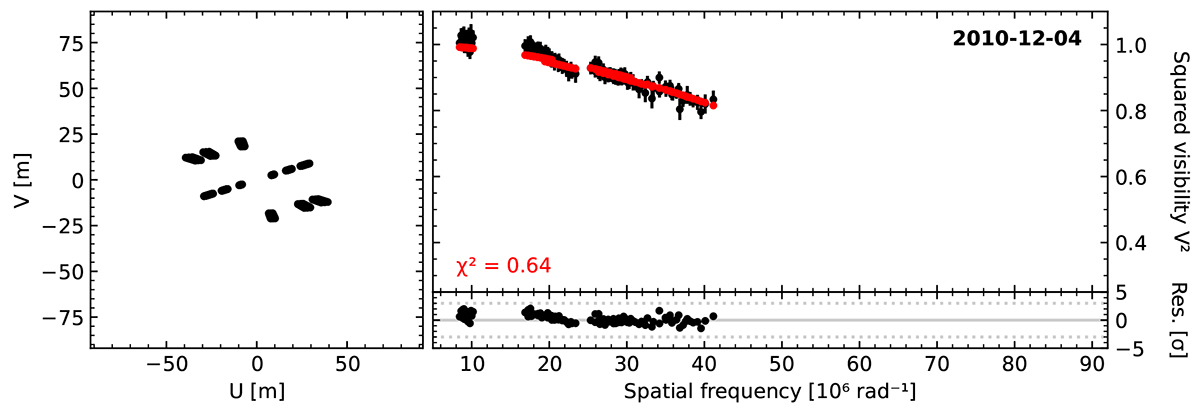
Fig. A.1.
Download original image
VLTI/PIONIER uv-plane coverage (left panel) and squared visibilities as a function of spatial frequency (right panel) observed on 4 December 2010 (orbital phase 0.79). The observed data are shown in black, and the best-fitting model (Roche-lobe filling star; simultaneous fit to squared visibilities and closure phases) is shown in red.
Current usage metrics show cumulative count of Article Views (full-text article views including HTML views, PDF and ePub downloads, according to the available data) and Abstracts Views on Vision4Press platform.
Data correspond to usage on the plateform after 2015. The current usage metrics is available 48-96 hours after online publication and is updated daily on week days.
Initial download of the metrics may take a while.