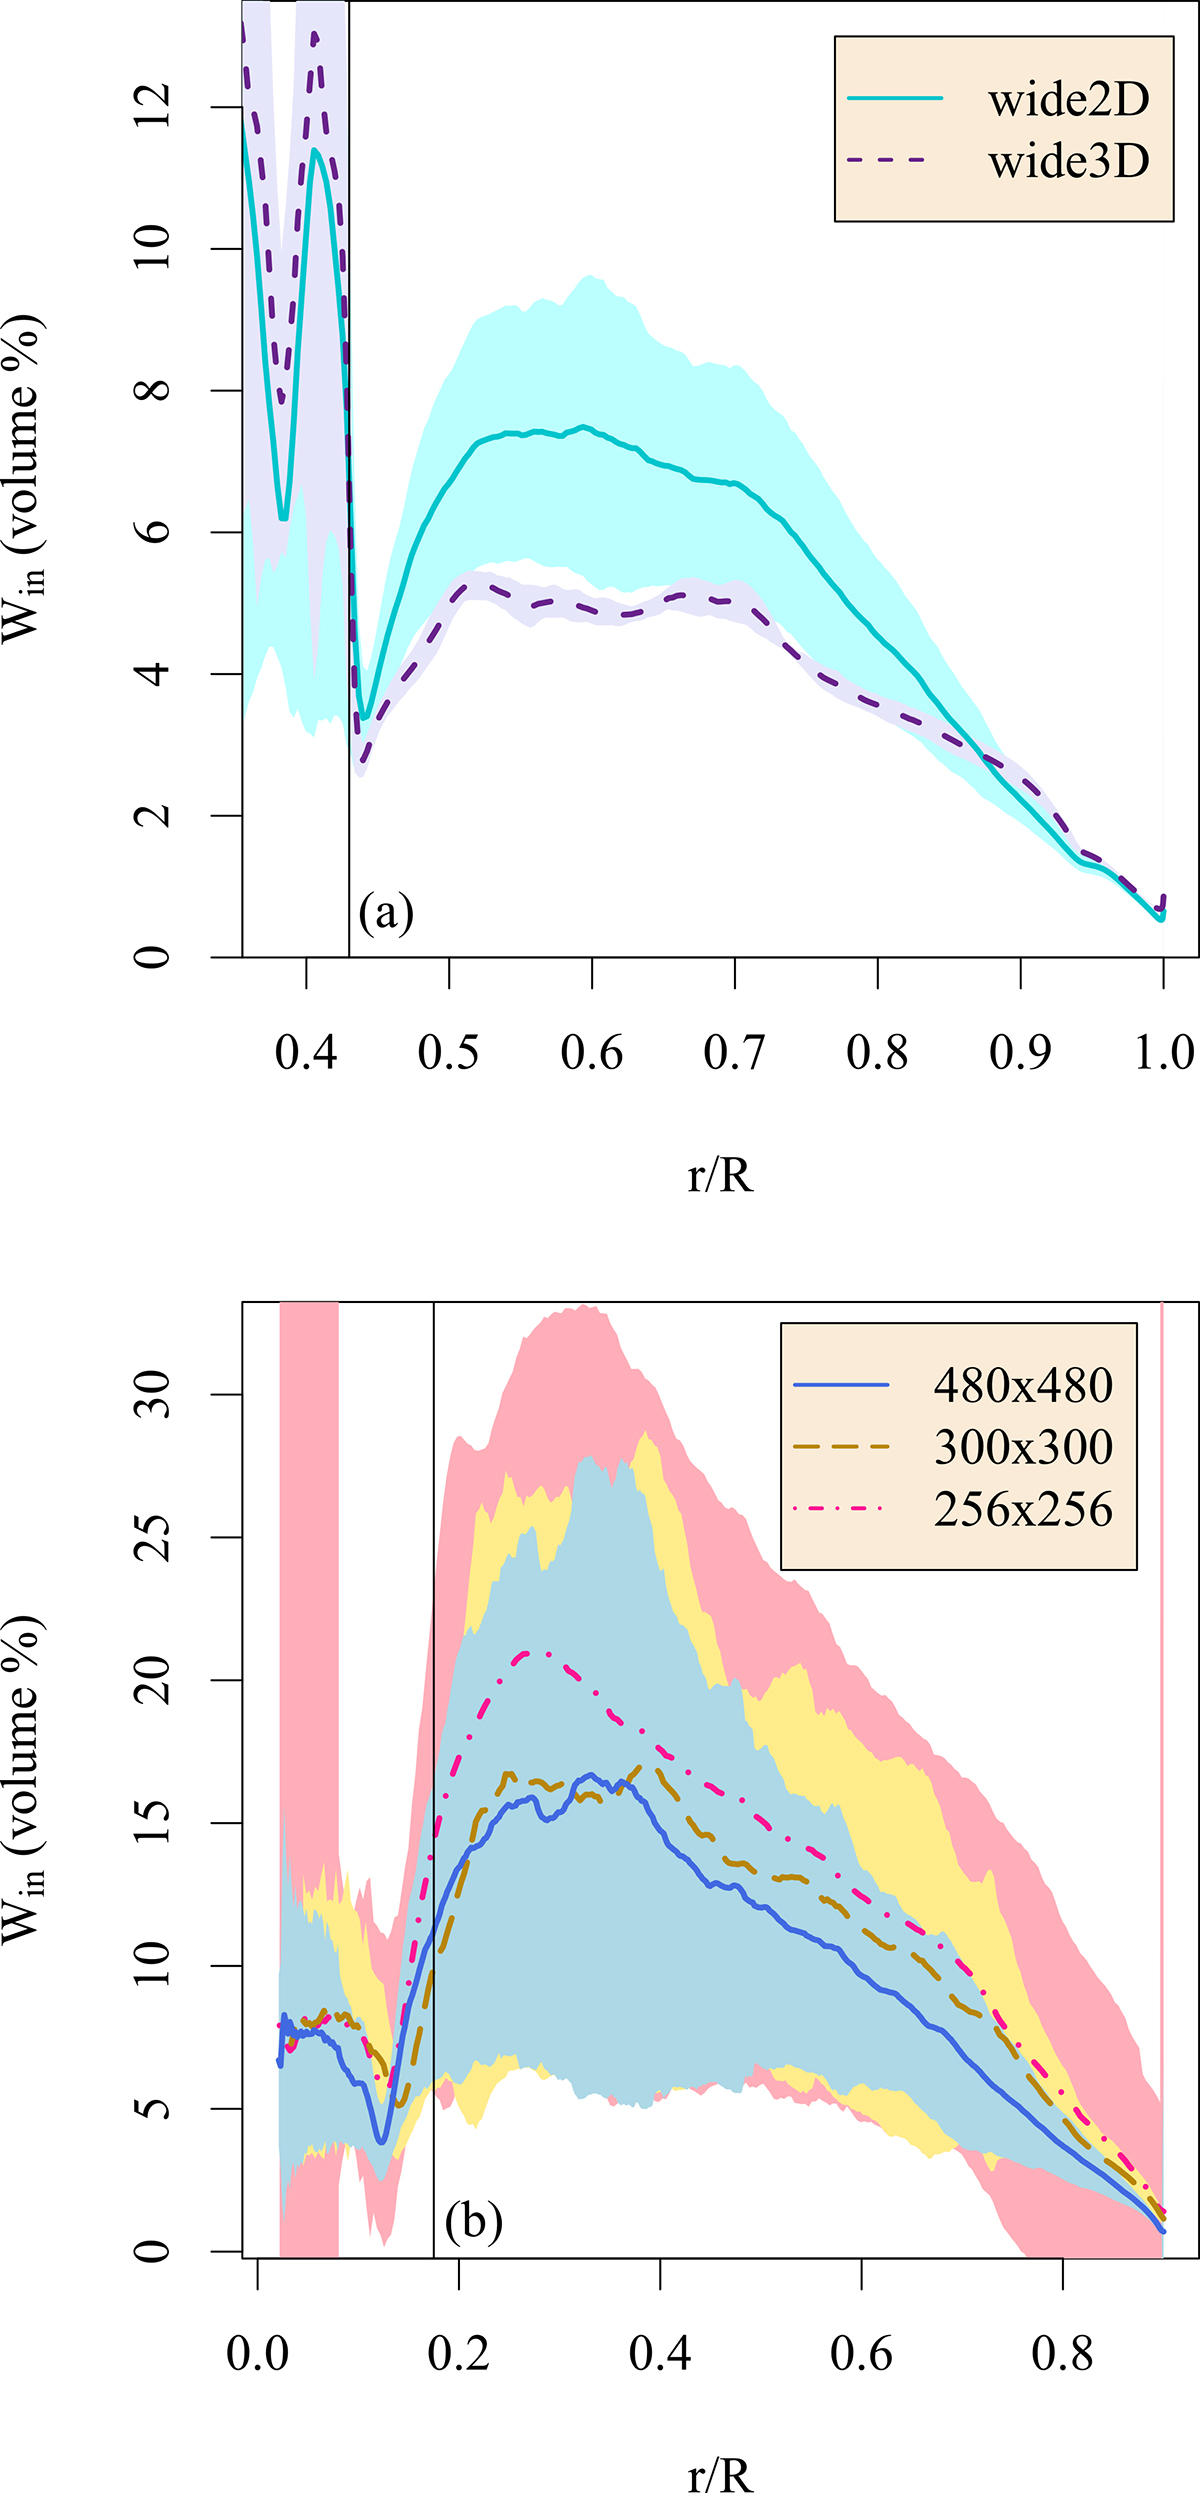
Fig. 12.
Download original image
Widths of inflowing plumes for (a) 2D and 3D simulations of the young sun, and (b) three 2D simulations of the red giant that have different grid sizes as labeled, but are otherwise identical. The shaded region represents one standard deviation above and below the time-averaged line. The radial position of the convective boundarydetermined by the Schwarzschild criterion is indicated by a vertical black line.
Current usage metrics show cumulative count of Article Views (full-text article views including HTML views, PDF and ePub downloads, according to the available data) and Abstracts Views on Vision4Press platform.
Data correspond to usage on the plateform after 2015. The current usage metrics is available 48-96 hours after online publication and is updated daily on week days.
Initial download of the metrics may take a while.