Fig. 1.
Download original image
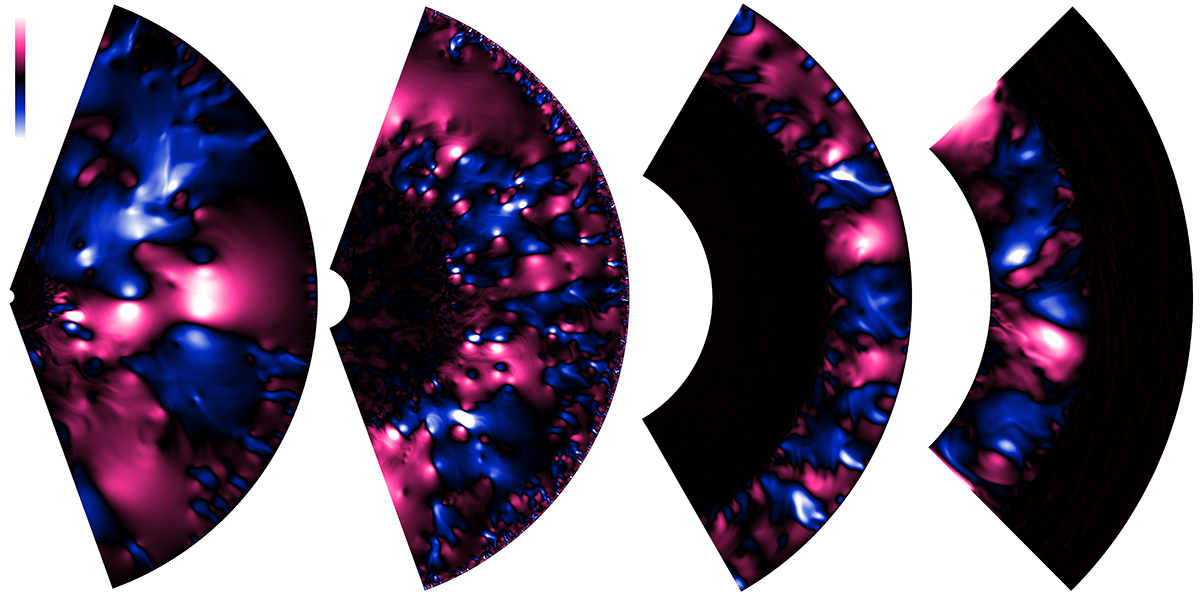
Visualizations of radial velocity in 2D simulations (from left to right) bg2D, wm2D, dcs2D, and cc2D. Outward flows are indicated in pink, while inward flows are in blue; the zero point in velocity is black. The maximum and minimum values of the color scale are defined by a radial velocity magnitude near the maximum for each simulation: bg2D (±6.5 km/s), wm2D (±2.9 km/s), dcs2D (±0.63 km/s), cc2D (±1.5 km/s).
Current usage metrics show cumulative count of Article Views (full-text article views including HTML views, PDF and ePub downloads, according to the available data) and Abstracts Views on Vision4Press platform.
Data correspond to usage on the plateform after 2015. The current usage metrics is available 48-96 hours after online publication and is updated daily on week days.
Initial download of the metrics may take a while.