Fig. 6.
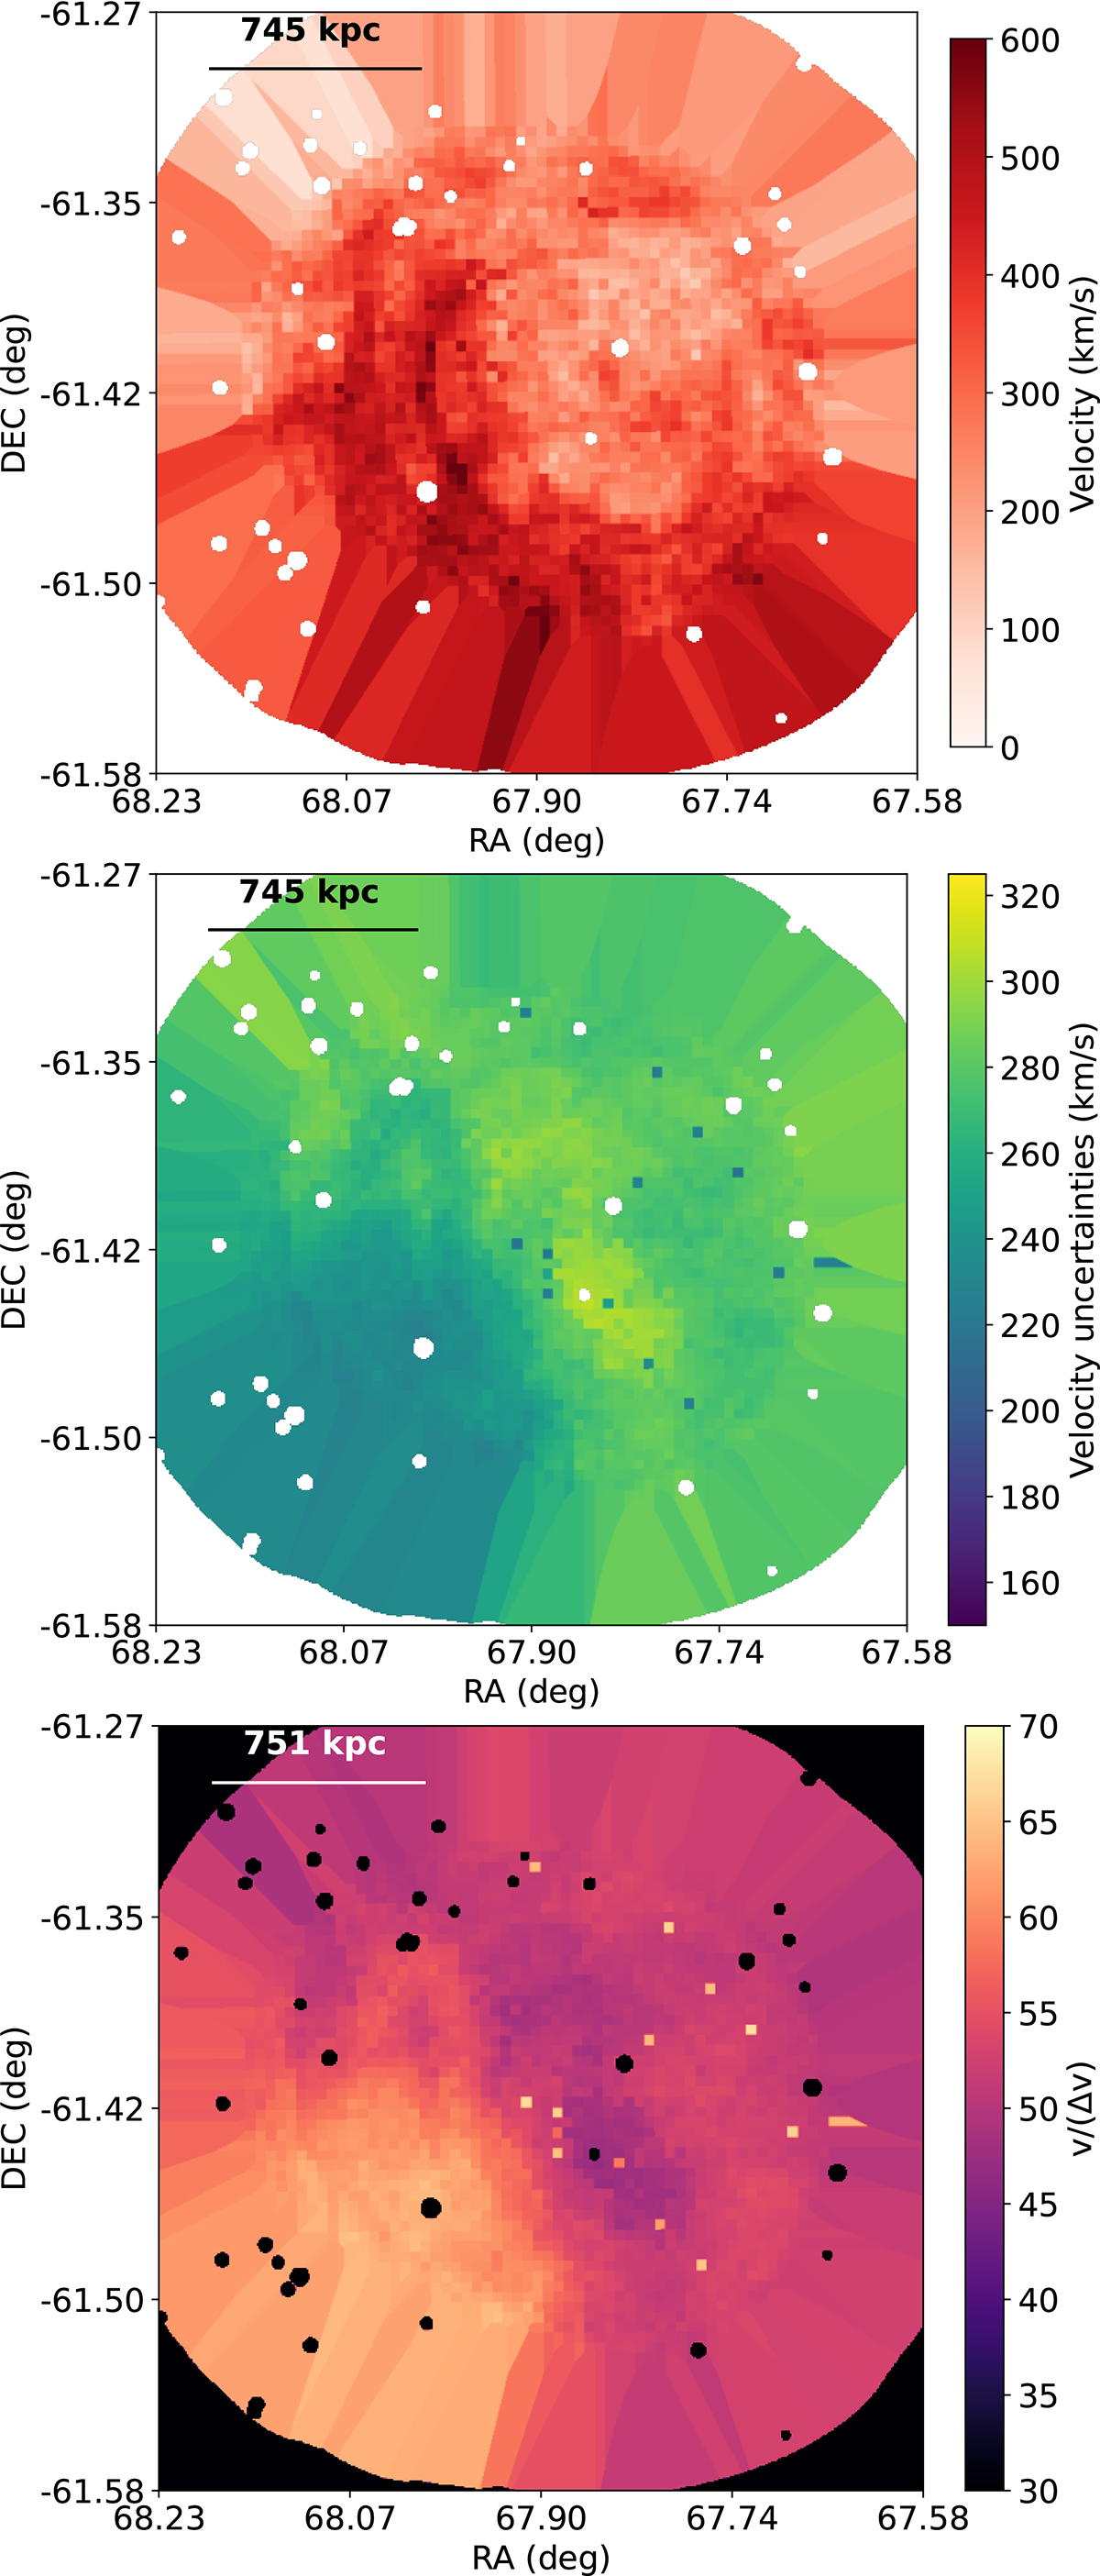
Download original image
Velocity maps for the A3266 cluster. Top panel: Velocity map (km/s) relative to the A3266 cluster (z = 0.0594). Maps were created by moving 2:1 elliptical regions (i.e., rotated to lie tangentially to the nucleus) containing ∼750 counts in the Fe-K region. Middle panel: 1σ velocity uncertainties. White circles correspond to point sources which were excluded from the analysis. The spectral fitting was done in the 4 − 9.25 keV energy range. Bottom panel: Significance of the velocity measurements (v/Δv).
Current usage metrics show cumulative count of Article Views (full-text article views including HTML views, PDF and ePub downloads, according to the available data) and Abstracts Views on Vision4Press platform.
Data correspond to usage on the plateform after 2015. The current usage metrics is available 48-96 hours after online publication and is updated daily on week days.
Initial download of the metrics may take a while.