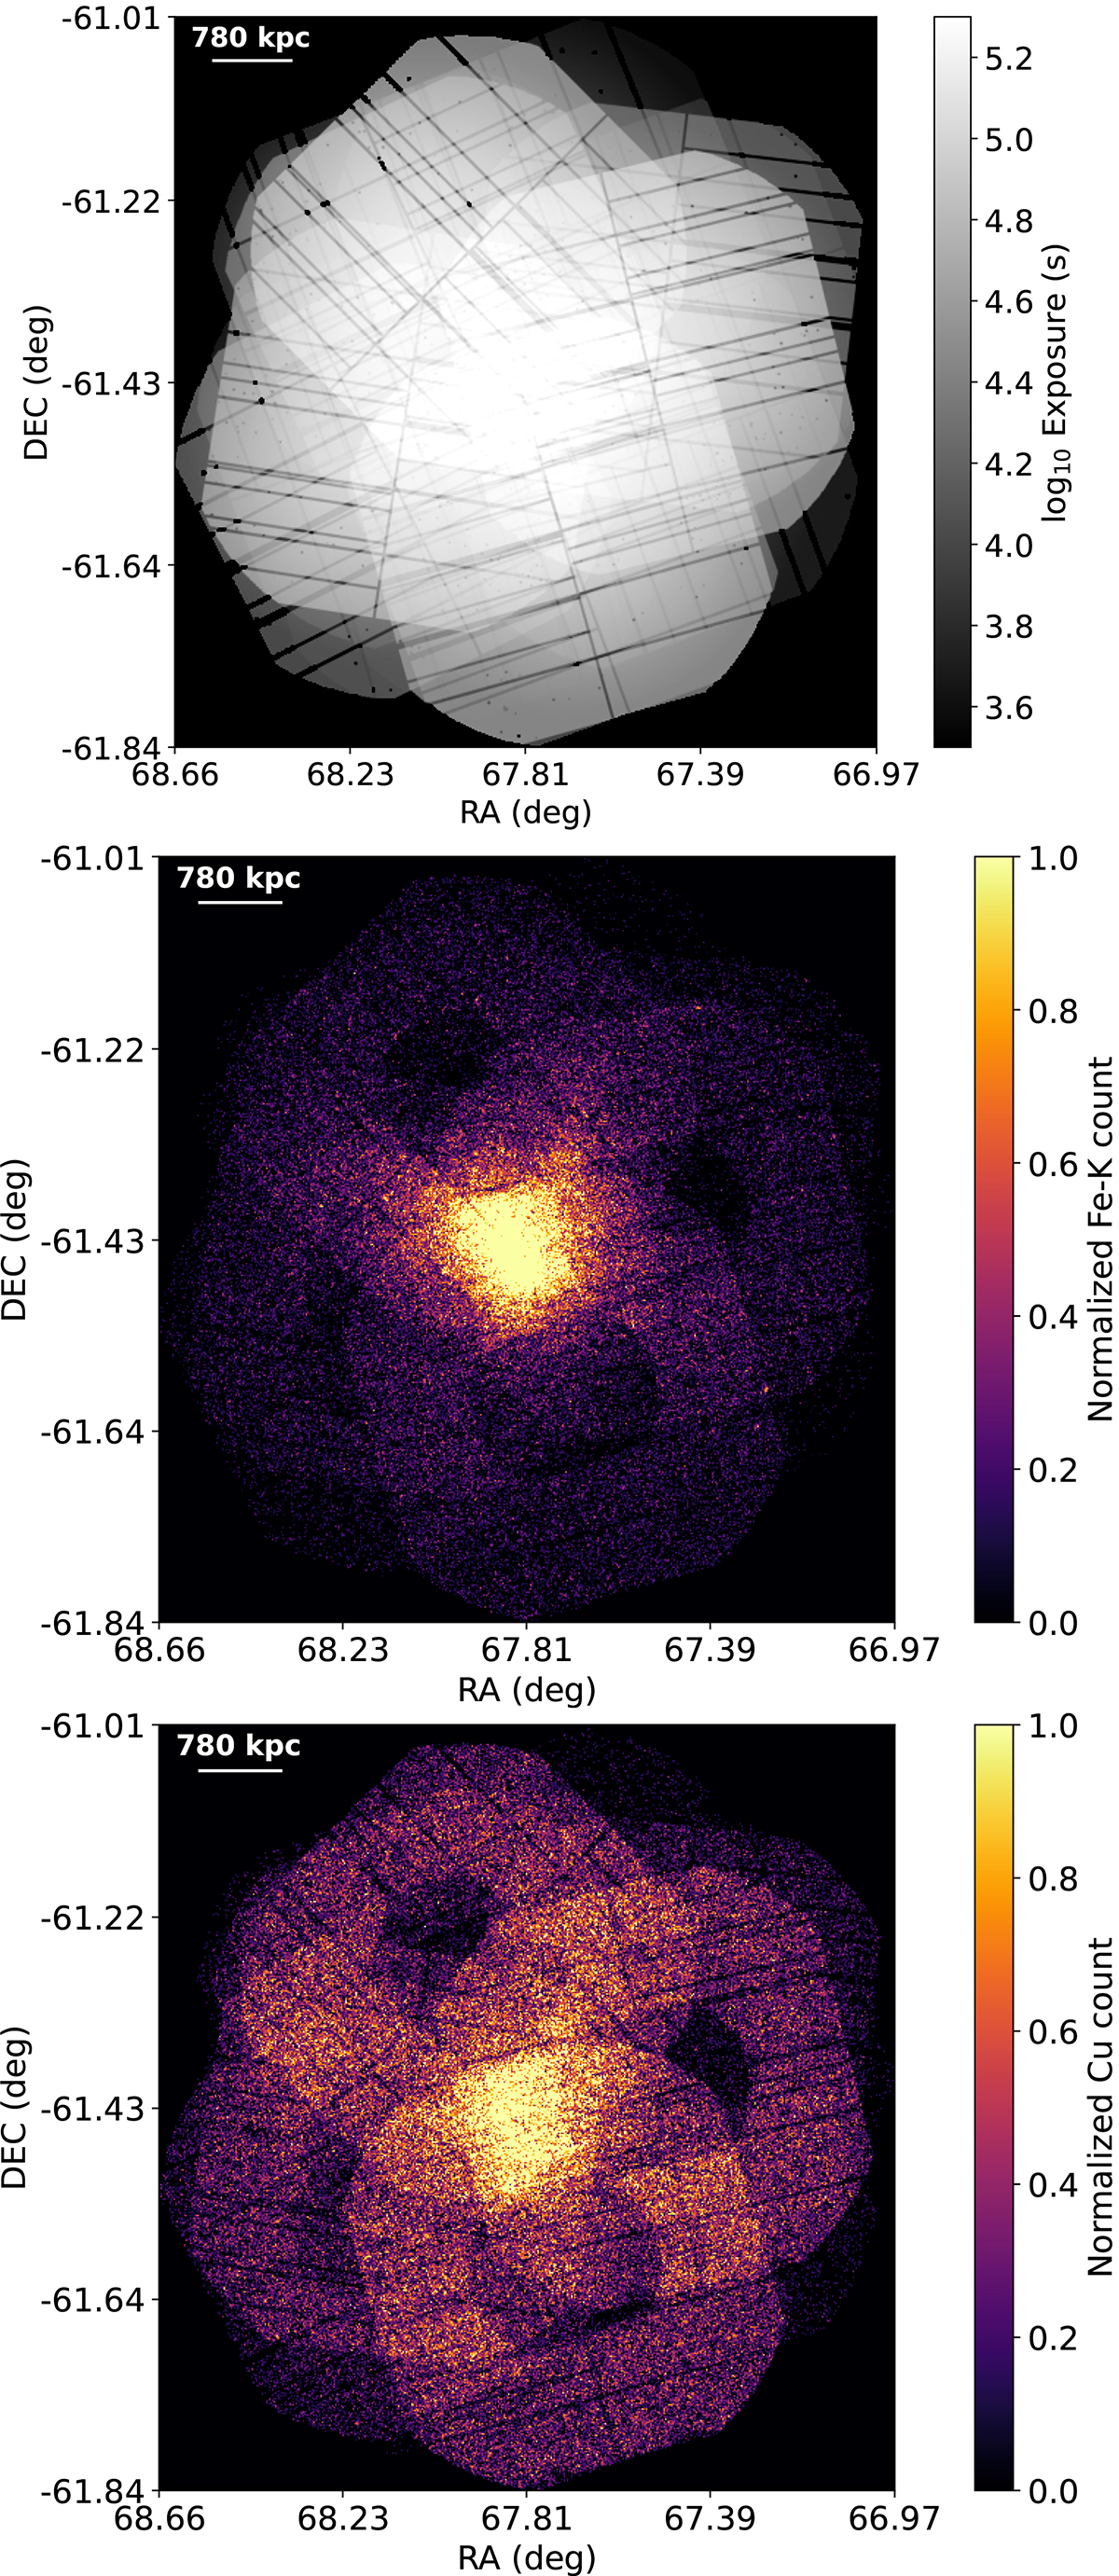
Fig. 2.
Download original image
Exposure maps and Fe, Cu counts map for the A3266 cluster. Top panel: Total exposure time (s) in the 0.5–9.25 keV energy range. Middle panel: Normalized Fe-K count map, showing the number of counts in each 1.59 arcsec pixel in the Fe-K complex with the instrumental Cu ring included to indicate the regions in which the redshift can be measured. Bottom panel: Normalized background Cu count map, showing the number of counts in each 1.59 arcsec pixel in the Cu Kα line energy range.
Current usage metrics show cumulative count of Article Views (full-text article views including HTML views, PDF and ePub downloads, according to the available data) and Abstracts Views on Vision4Press platform.
Data correspond to usage on the plateform after 2015. The current usage metrics is available 48-96 hours after online publication and is updated daily on week days.
Initial download of the metrics may take a while.