Fig. 1.
Download original image
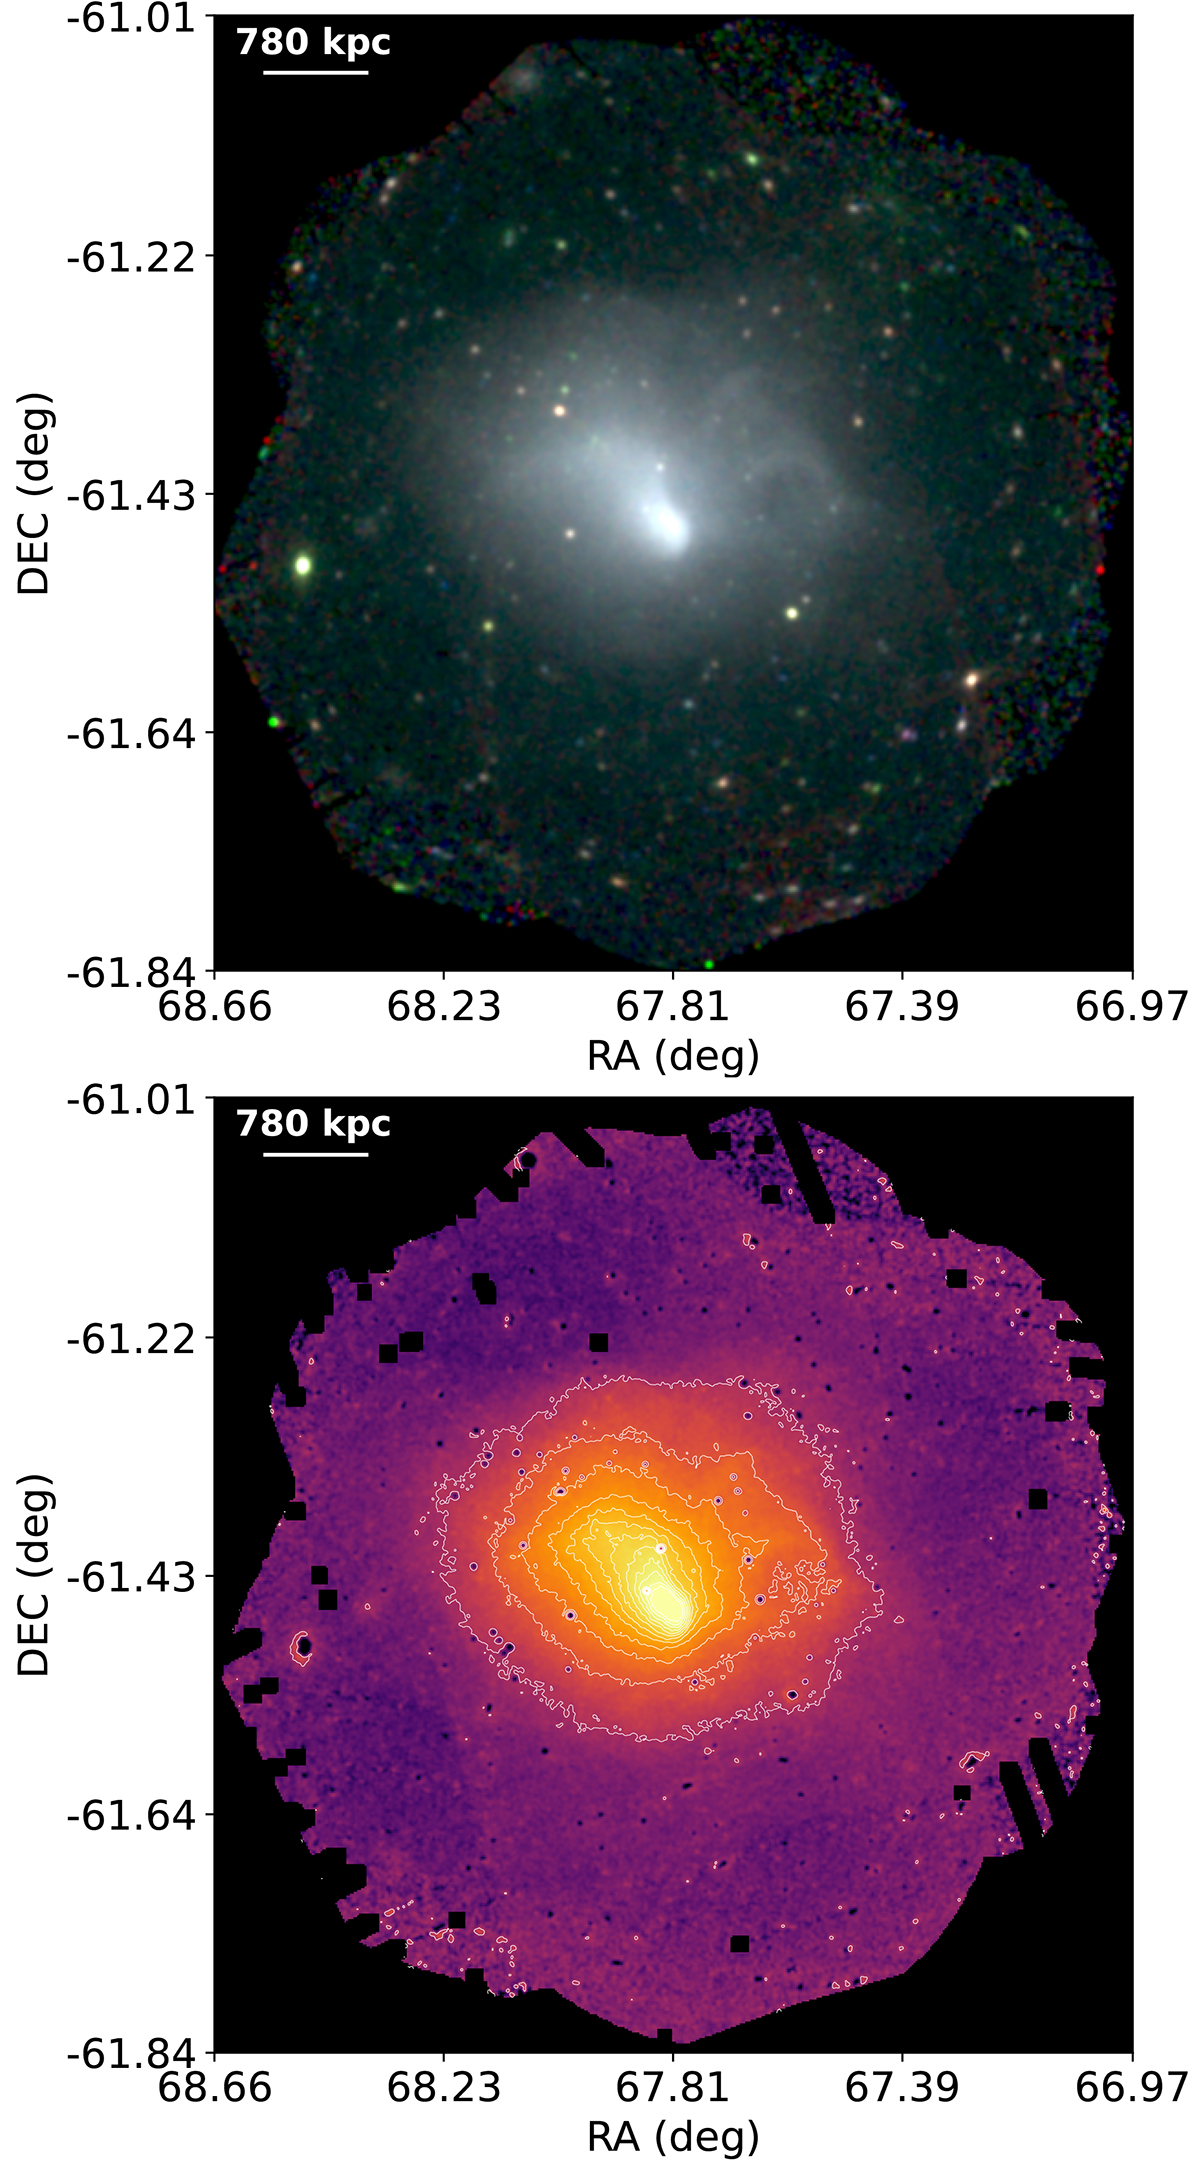
RGB and X-ray images of the A3266 cluster. Top panel: RGB image of A3266. The bands used are 0.2–0.5 keV (R), 0.5–1.0 keV (G), and 1.0–2.0 keV (B). We applied a σ = 1 Gaussian smoothing to the exposure-corrected and background-subtracted image. Bottom panel: Exposure-corrected and background-subtracted X-ray surface brightness of the A3266 cluster in the 0.5–9.25 keV energy range. The point-like sources were excluded in the analysis. The 10-level contours of the X-ray image are shown in white.
Current usage metrics show cumulative count of Article Views (full-text article views including HTML views, PDF and ePub downloads, according to the available data) and Abstracts Views on Vision4Press platform.
Data correspond to usage on the plateform after 2015. The current usage metrics is available 48-96 hours after online publication and is updated daily on week days.
Initial download of the metrics may take a while.