Fig. 8.
Download original image
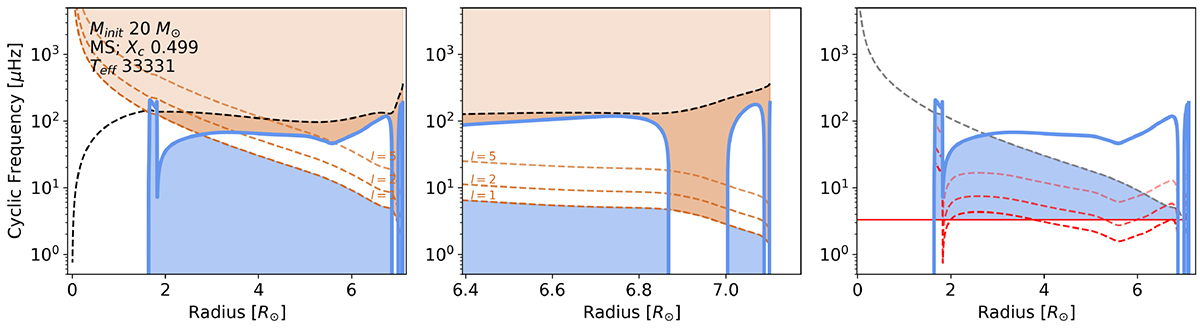
Propagation diagram for a 20 M⊙ MS star model. The x-axis represents the radius in solar radii, and the y-axis shows the cyclic frequency in microhertz. The left and right panels show the full radius, while the middle panel shows the external 10% of the radius. The blue line represents the Brunt-Väisälä frequency N, the brown dashed lines correspond to the Lamb frequencies Sl for different spherical harmonic degrees l, and the black dashed line shows the profile of the acoustic cut-off frequency. The blue-shaded region shows the g-mode cavity, and the brown-shaded region – p-mode cavity. The right panel shows profiles of tunnelling ωmin for l = 1,2,5 in dashed red lines and one horizontal value of ωmin taken near the convective layer (see text for details). Profiles of ωmin collapse to an apparent vertical line in the He convection zone, and this particular zone is better resolved in zoomed version of the figure in Appendix D.
Current usage metrics show cumulative count of Article Views (full-text article views including HTML views, PDF and ePub downloads, according to the available data) and Abstracts Views on Vision4Press platform.
Data correspond to usage on the plateform after 2015. The current usage metrics is available 48-96 hours after online publication and is updated daily on week days.
Initial download of the metrics may take a while.