Open Access
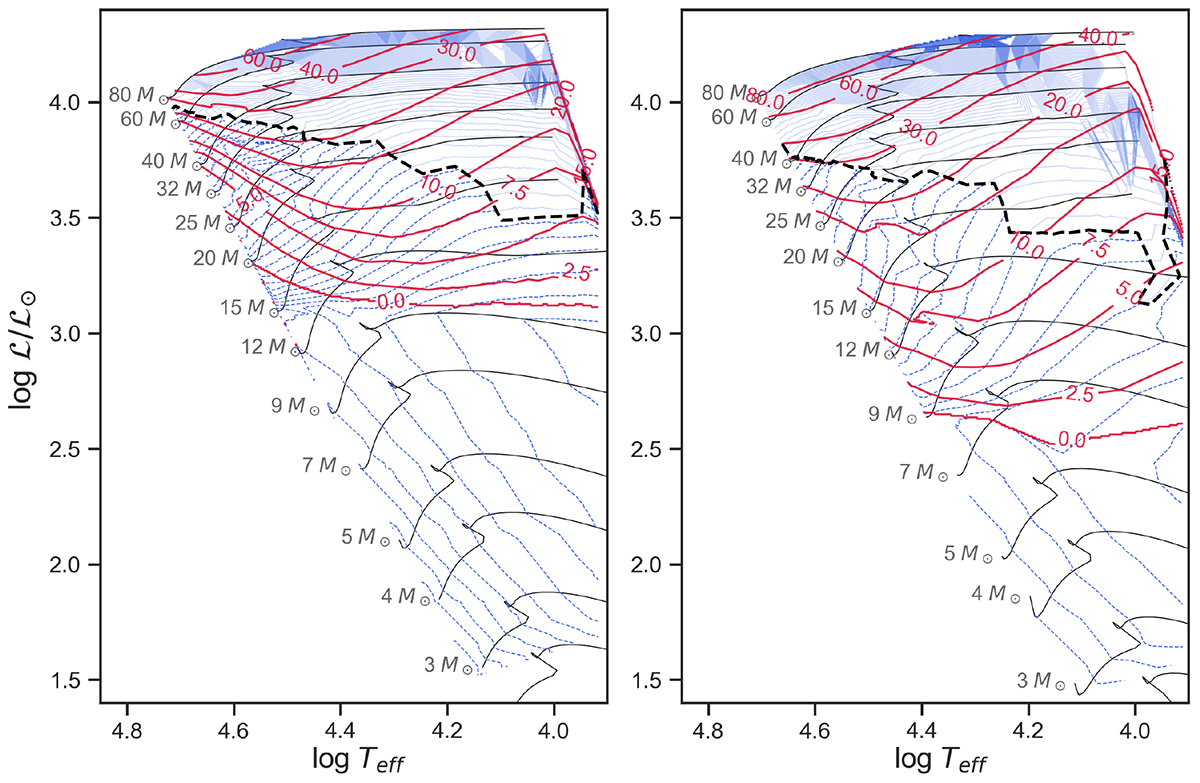
Fig. 10.
Download original image
Level plot of FeCZ maximal convective velocities (in solid red lines) and tunnelling frequency ωmin (in dashed blue lines; see text for details). The thick dashed black line separates the region of forbidden tunnelling (above the line) through subsurface convective layers.
Current usage metrics show cumulative count of Article Views (full-text article views including HTML views, PDF and ePub downloads, according to the available data) and Abstracts Views on Vision4Press platform.
Data correspond to usage on the plateform after 2015. The current usage metrics is available 48-96 hours after online publication and is updated daily on week days.
Initial download of the metrics may take a while.