Fig. 4.
Download original image
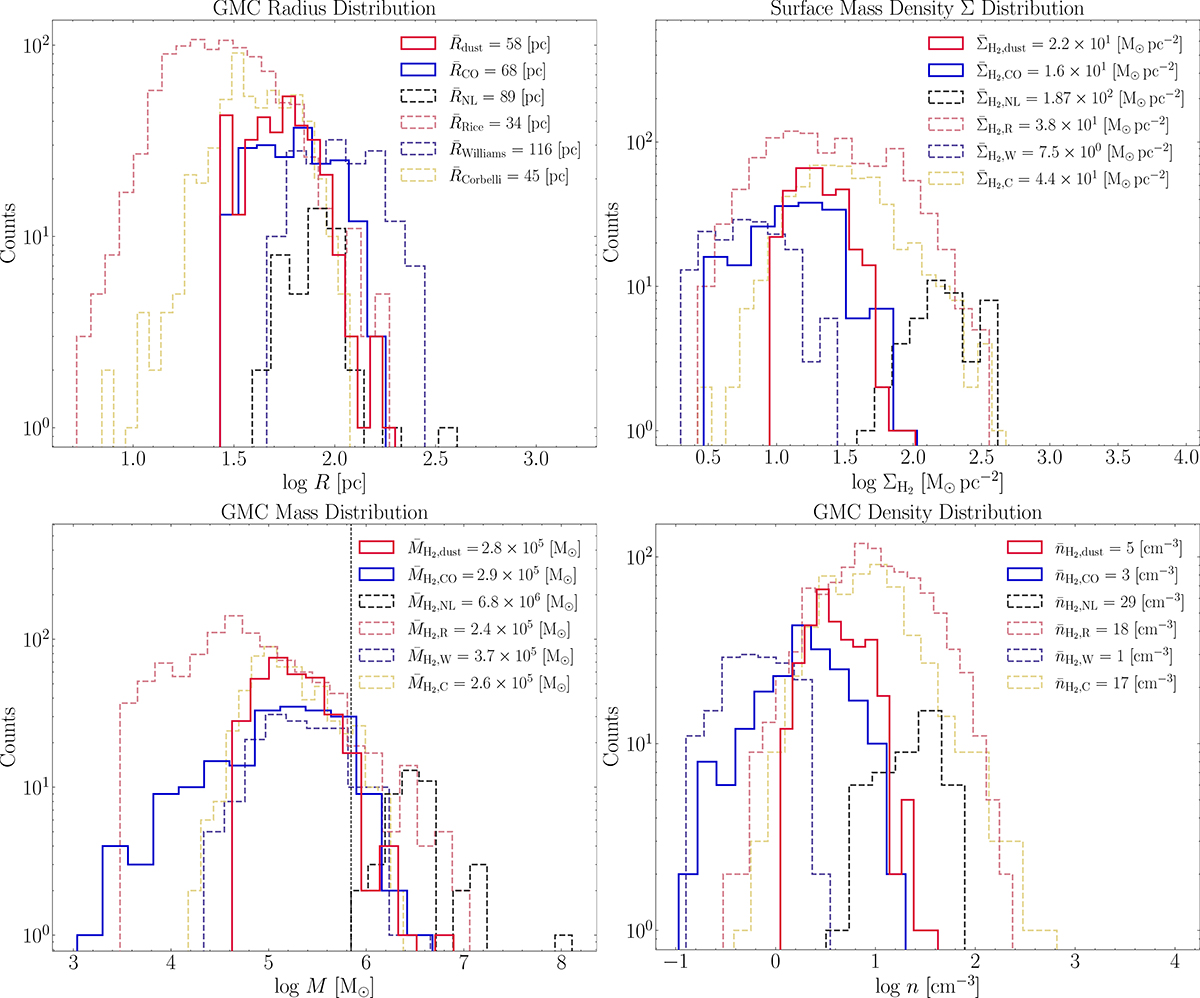
Distributions of GMC properties from our study and the literature. The panels show histograms of radius (top left), surface mass density (top right), mass (bottom left) and beam-averaged number density (bottom right) derived from H2 data from dust (solid red) and CO (solid blue) from this study. The dashed purple and golden lines display the distributions obtained for M33 from dust (Williams et al. 2019) and CO (Corbelli et al. 2017), respectively. The dashed black and light red lines give the distributions for the Milky Way studies of NL16 and Rice et al. (2016), respectively. The vertical black dashed line in the mass distribution signifies the minimum mass limit of the selected structures in the Milky Way by NL16.
Current usage metrics show cumulative count of Article Views (full-text article views including HTML views, PDF and ePub downloads, according to the available data) and Abstracts Views on Vision4Press platform.
Data correspond to usage on the plateform after 2015. The current usage metrics is available 48-96 hours after online publication and is updated daily on week days.
Initial download of the metrics may take a while.