Open Access
Fig. 3.
Download original image
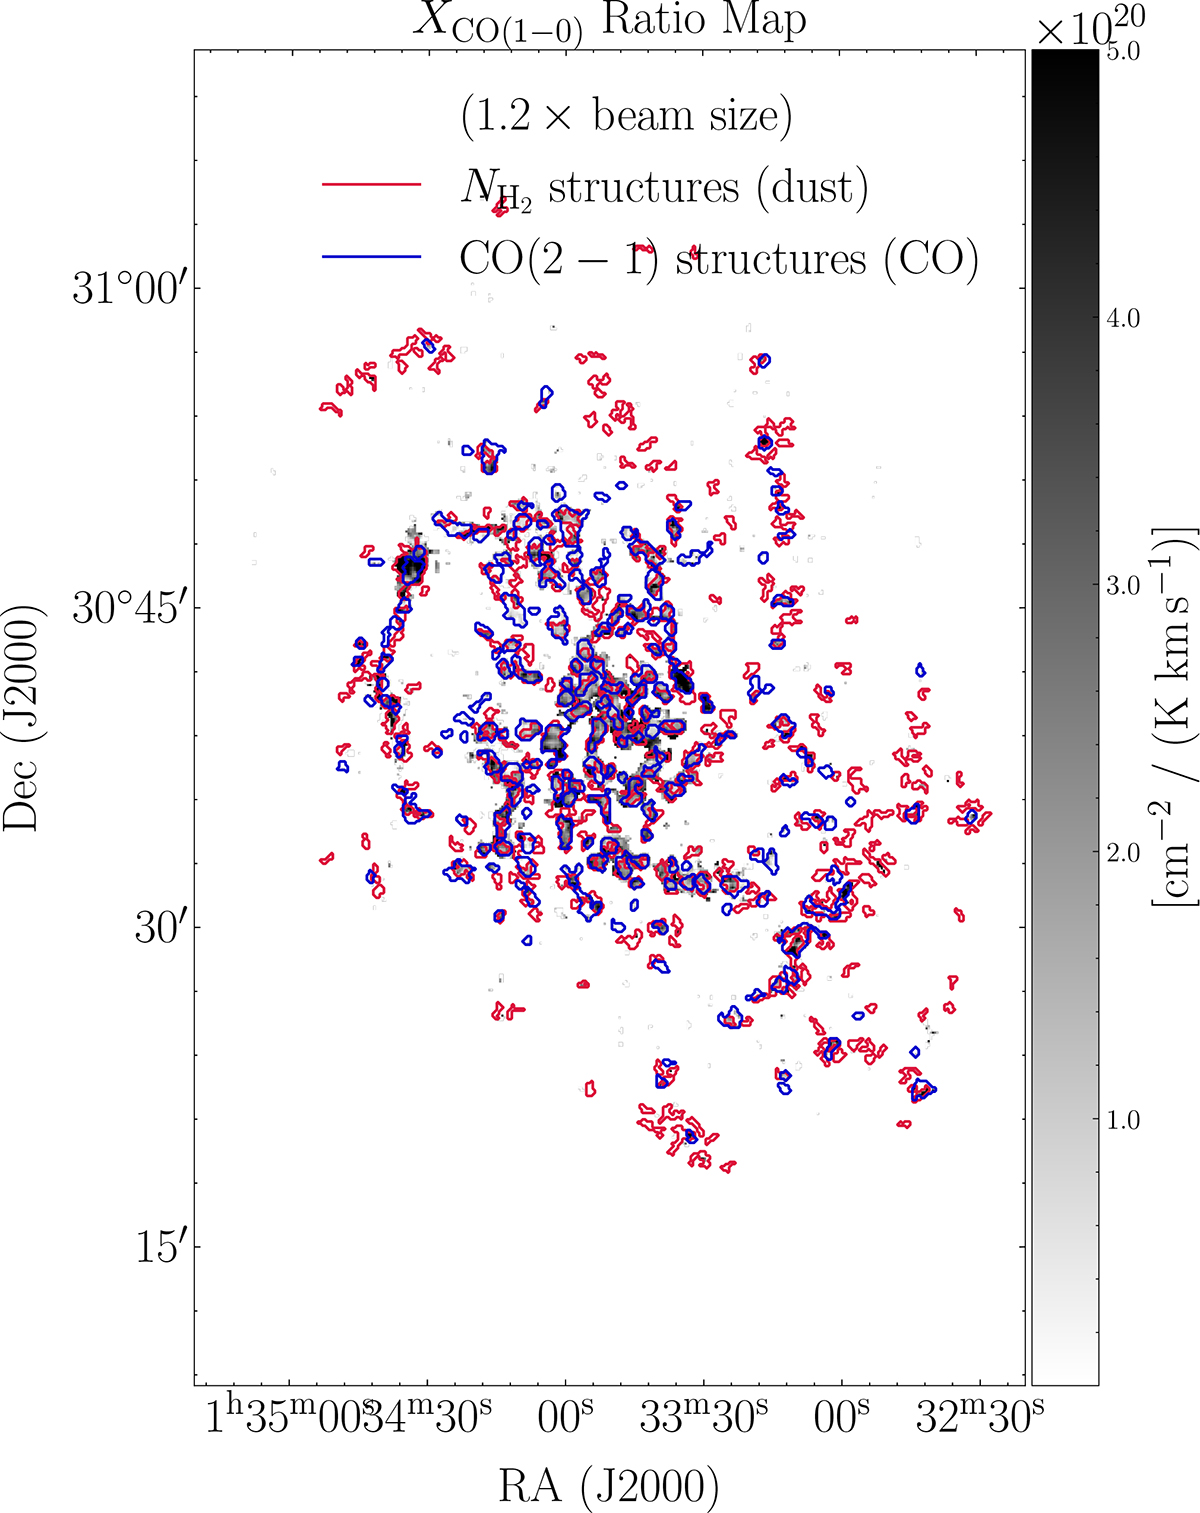
Structures identified using Dendrograms on CO and dust-derived maps superimposed on the XCO map. The structures found in the dust-derived NH2 (red) and in the CO map (blue) are mapped onto the XCO factor (ratio) map, which represents the dust-derived H2 column density over CO intensity from Paper I.
Current usage metrics show cumulative count of Article Views (full-text article views including HTML views, PDF and ePub downloads, according to the available data) and Abstracts Views on Vision4Press platform.
Data correspond to usage on the plateform after 2015. The current usage metrics is available 48-96 hours after online publication and is updated daily on week days.
Initial download of the metrics may take a while.