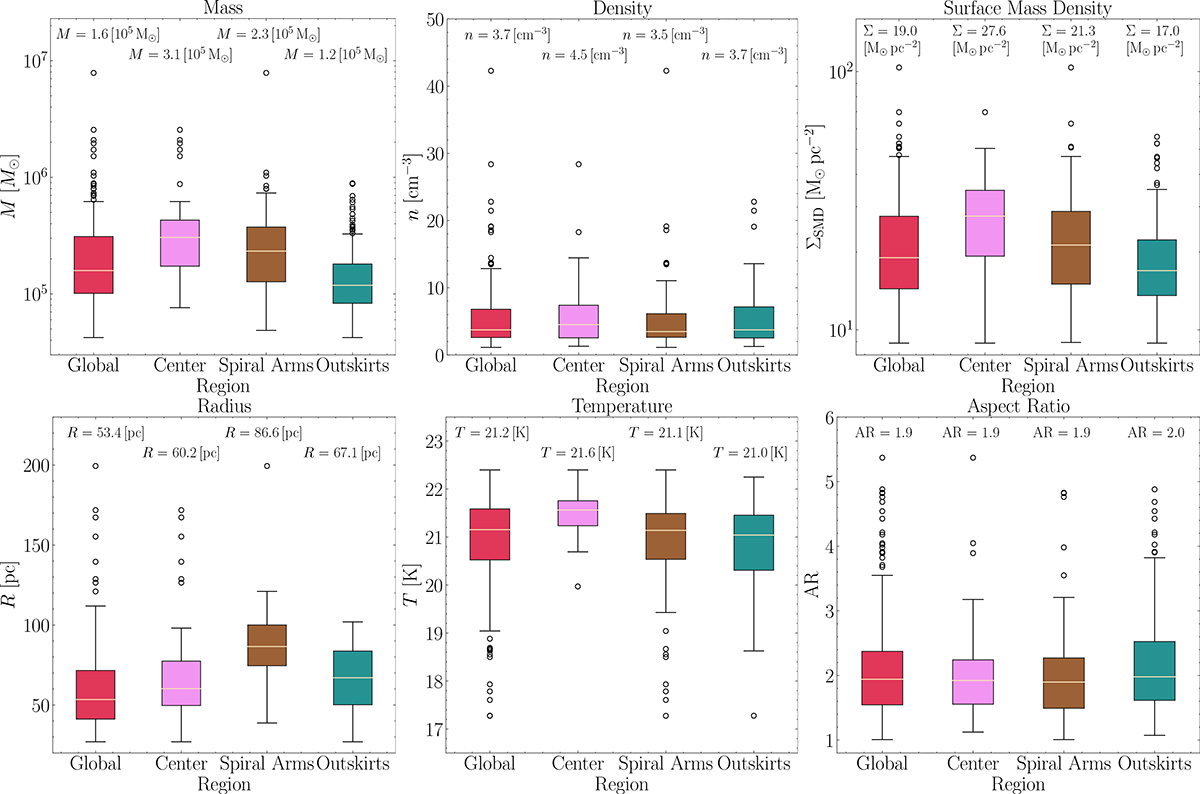
Fig. 10.
Download original image
Box plots of the determined dust-derived parameters categorized based on galactic environments. The lower and upper whiskers of the box plot represent the lowest and maximum values of the dataset, respectively. The colored box shows the distribution’s interquartile spread, or the range from the 25th to the 75th percentile; the median is indicated by the solid beige line inside the box. The distributions’ outliers are shown as circles.
Current usage metrics show cumulative count of Article Views (full-text article views including HTML views, PDF and ePub downloads, according to the available data) and Abstracts Views on Vision4Press platform.
Data correspond to usage on the plateform after 2015. The current usage metrics is available 48-96 hours after online publication and is updated daily on week days.
Initial download of the metrics may take a while.