Fig. 1.
Download original image
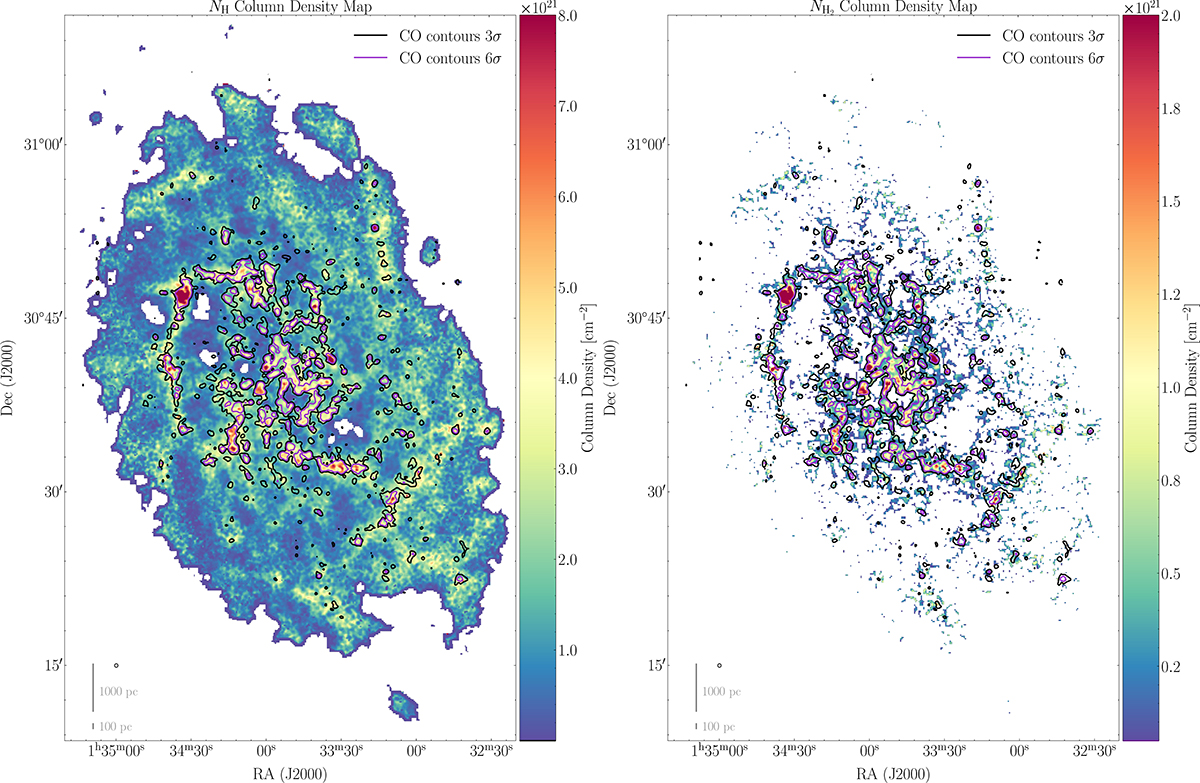
Total and molecular hydrogen column density maps. Left: High-resolution N(H) total gas column density map obtained from the Herschel flux maps of M33 with 18.2″ angular resolution (indicated by the circle in the lower left corner) using the β map from Tabatabaei et al. (2014). Values below and above a minimum and maximum threshold (1018 cm−2 and 1022 cm−2, respectively) are blanked. Right: High-resolution H2 column density map derived from the total N(H) map by subtracting the H I component. In both maps, the CO contour levels 3 and 6σ of the CO map (Fig. A.1 in Appendix A) are shown.
Current usage metrics show cumulative count of Article Views (full-text article views including HTML views, PDF and ePub downloads, according to the available data) and Abstracts Views on Vision4Press platform.
Data correspond to usage on the plateform after 2015. The current usage metrics is available 48-96 hours after online publication and is updated daily on week days.
Initial download of the metrics may take a while.