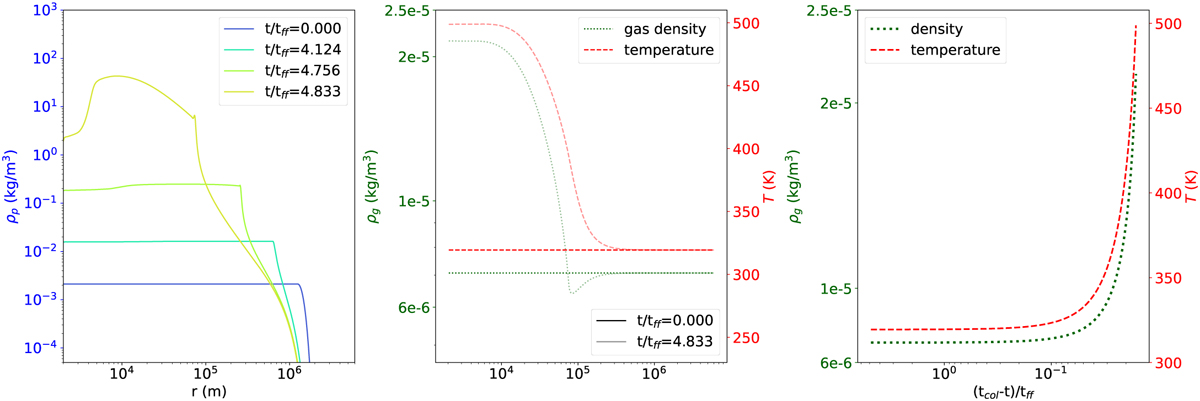
Fig. C.2
Download original image
Evolution of the cloud during the collapse. Left: time evolution of the radial profile of the particle cloud density. Centre: gas temperature profiles (dashed) and gas density profiles (dotted), plotted at the beginning and the end of the fiducial run. Right: time evolution of the central density (dotted) and temperature (dashed, right axis) of the gas.
Current usage metrics show cumulative count of Article Views (full-text article views including HTML views, PDF and ePub downloads, according to the available data) and Abstracts Views on Vision4Press platform.
Data correspond to usage on the plateform after 2015. The current usage metrics is available 48-96 hours after online publication and is updated daily on week days.
Initial download of the metrics may take a while.