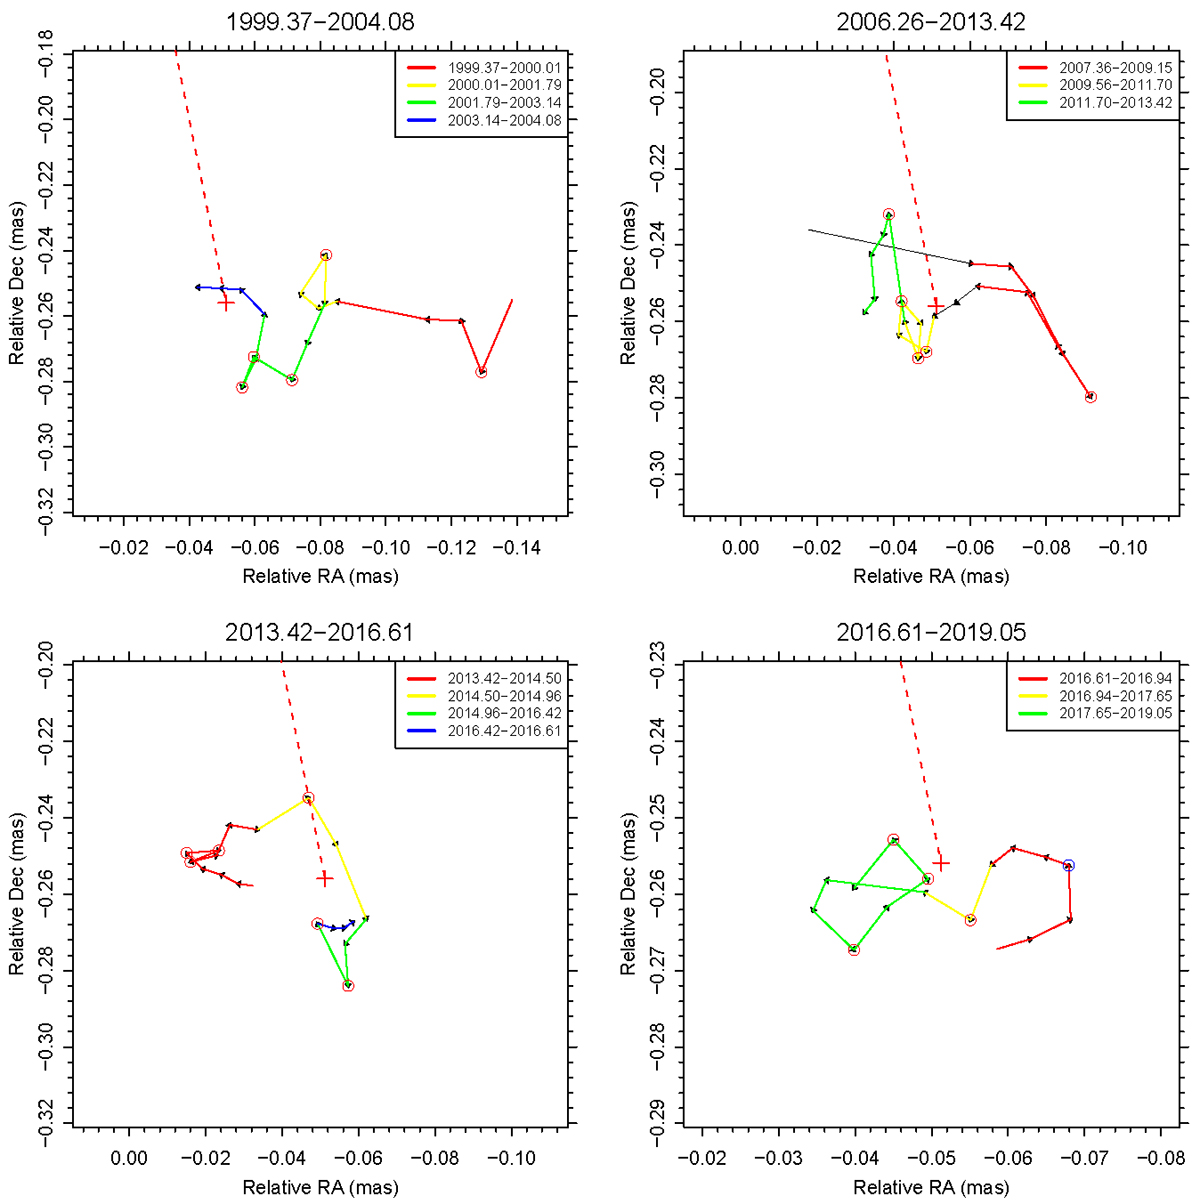
Fig. 5.
Download original image
Refined trajectory of C7 shown for four time intervals: 1999.37–2004.08, 2006.26–2013.42, 2013.42–2016.61, and 2016.61–2019.05. The arrows indicate the direction of movement. Red circles indicate reversal points for R- and RL-type; blue circles for A-type. Coloured sections of the trajectory indicate the path lengths of identified reversals and their combinations. The median scatter position over the whole time range from 1999.37 to 2019.98 is marked with a red plus sign. The dashed red line is the jet central axis, which connects the median position of C7 and the radio core.
Current usage metrics show cumulative count of Article Views (full-text article views including HTML views, PDF and ePub downloads, according to the available data) and Abstracts Views on Vision4Press platform.
Data correspond to usage on the plateform after 2015. The current usage metrics is available 48-96 hours after online publication and is updated daily on week days.
Initial download of the metrics may take a while.