Fig. 1.
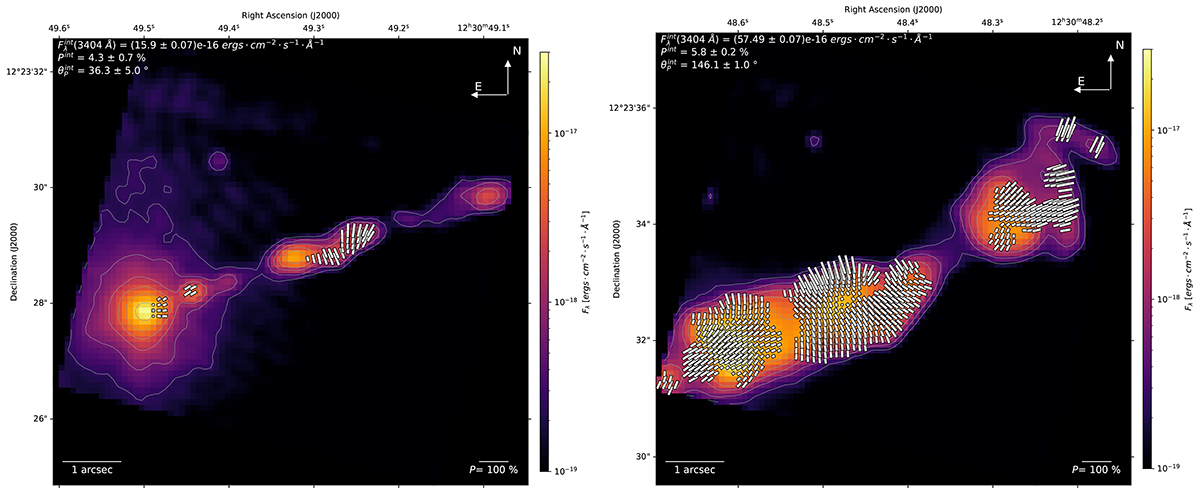
Download original image
Data products obtained from our reduction pipeline. Left: First 7 arcseconds of the jet (POS 1, 1995). Right: Last 7 arcseconds of the jet (POS 3, 1995). In both cases, the total flux (in ergs cm−2 s−1 Å−1) is color-coded and the flux contours are displayed for 0.8%, 2%, 5%, 10%, 20%, and 50% of the maximum flux. The polarization information is superimposed on the image using white vectors. P is proportional to the vector length and the angle of Ψ is given by the orientation of the vector. See Sect. 3 (POS 1) and Sect. 4 (POS 3) for an analysis of the images. Full-scale images with increased visibility of the polarization vectors are available on Zenodo.
Current usage metrics show cumulative count of Article Views (full-text article views including HTML views, PDF and ePub downloads, according to the available data) and Abstracts Views on Vision4Press platform.
Data correspond to usage on the plateform after 2015. The current usage metrics is available 48-96 hours after online publication and is updated daily on week days.
Initial download of the metrics may take a while.