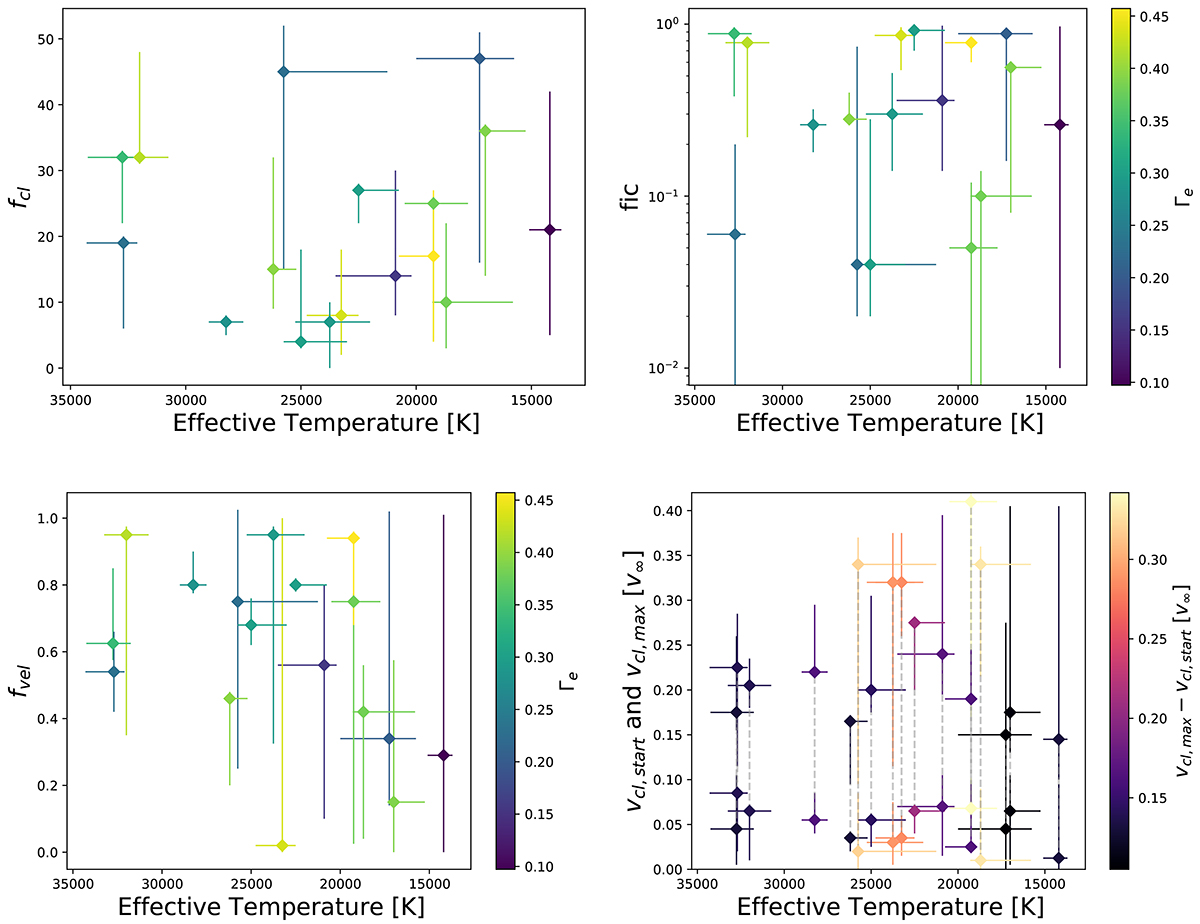
Fig. 10.
Download original image
Clumping parameters with respect to the effective temperature. The panels from top left to bottom right show the clumping factor, interclump density (in units of mean density), velocity filling factor and the onset clumping velocity (vcl, start) and the velocity of maximum clumping (vcl, max). The three first panels colour according to Γe for the stars, while in the last plot the colour indicates the difference between vcl, start and vcl, max. For each star in this plot the two points are connected by a dashed line (not visible in some objects as the error margins are covering the dashed line).
Current usage metrics show cumulative count of Article Views (full-text article views including HTML views, PDF and ePub downloads, according to the available data) and Abstracts Views on Vision4Press platform.
Data correspond to usage on the plateform after 2015. The current usage metrics is available 48-96 hours after online publication and is updated daily on week days.
Initial download of the metrics may take a while.