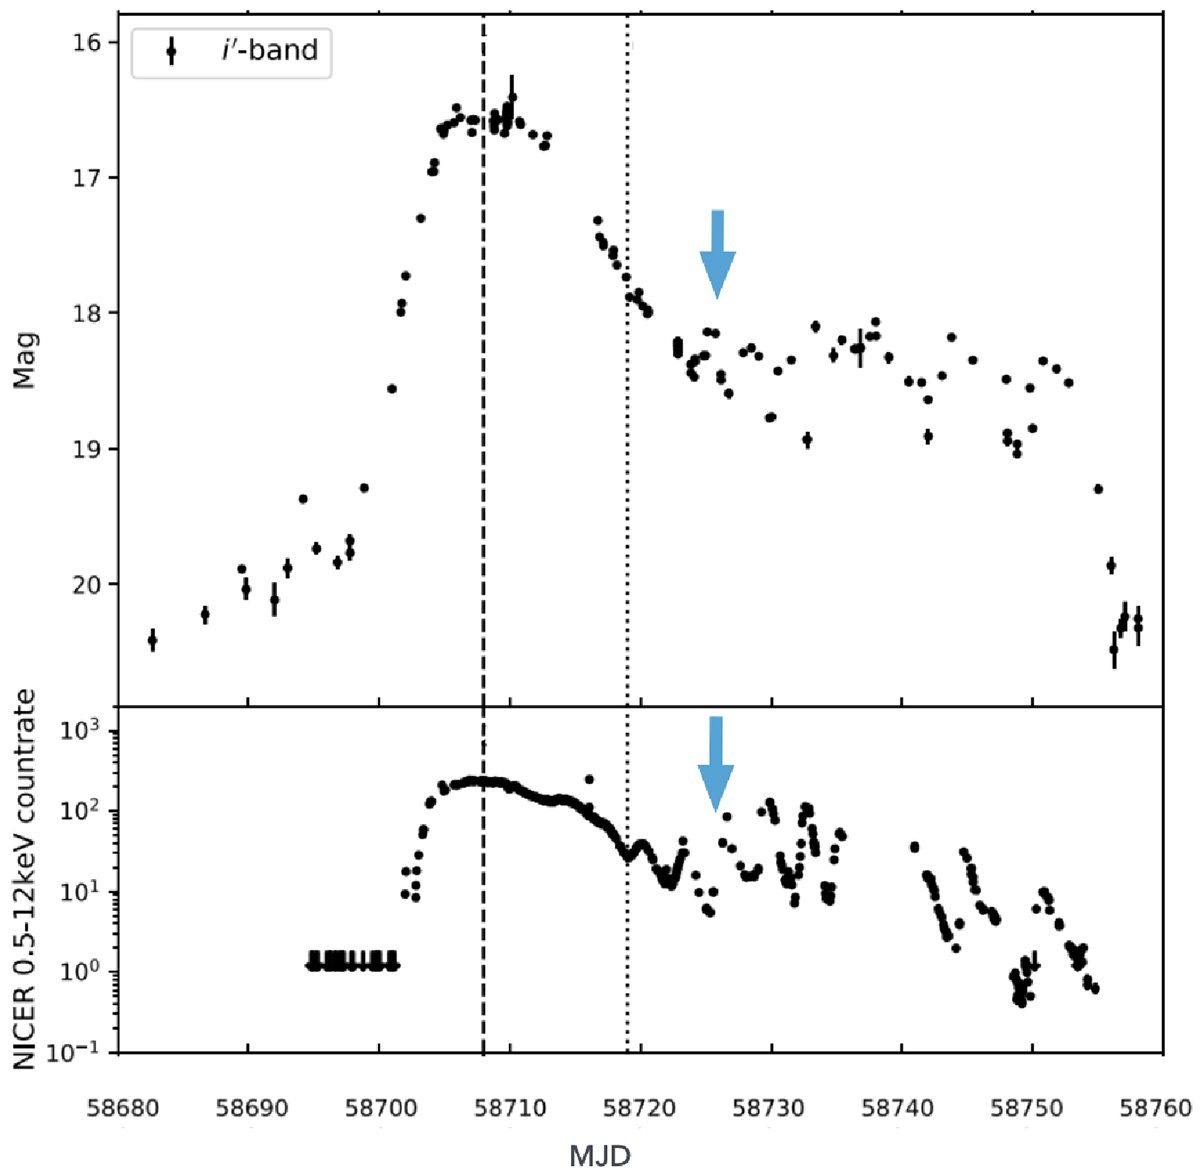
Fig. 1.
Download original image
Optical i′-band (top panel) and X-ray light curves (bottom panel) of the 2019 outburst, monitored, respectively, by LCO and NICER. Blue arrows point to MJD 58726.0093, when our X-shooter spectra were acquired. The dashed line indicates the peak of the X-ray outburst, while the dotted line indicates the beginning of the X-ray reflaring state. Figure adapted from Baglio et al. (2020).
Current usage metrics show cumulative count of Article Views (full-text article views including HTML views, PDF and ePub downloads, according to the available data) and Abstracts Views on Vision4Press platform.
Data correspond to usage on the plateform after 2015. The current usage metrics is available 48-96 hours after online publication and is updated daily on week days.
Initial download of the metrics may take a while.