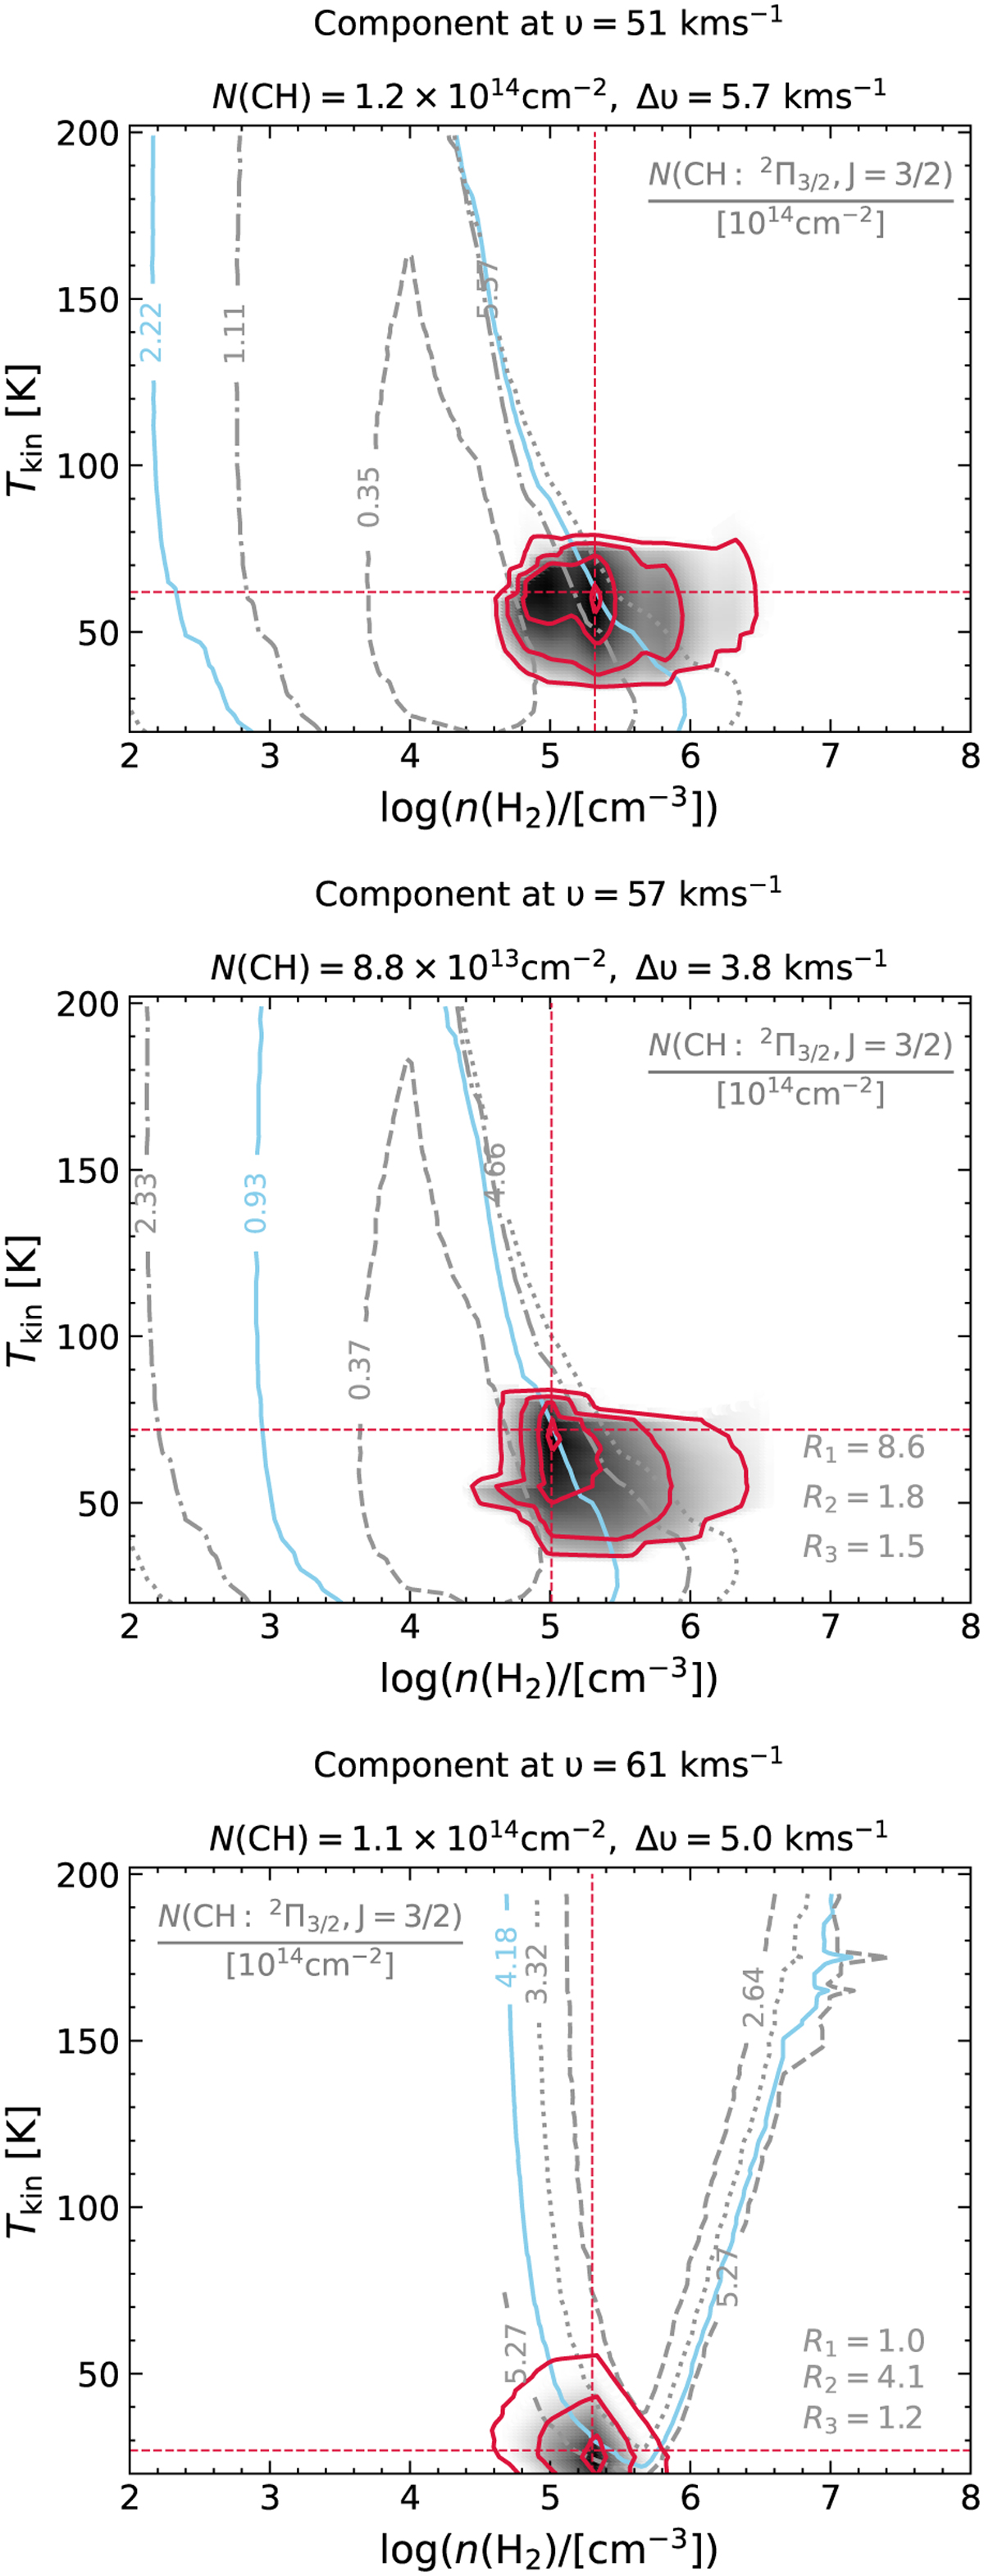
Fig. 8
Download original image
Same as Fig. 7 but for cloud components at υLSR = 51 (top), 57 (centre) and 61 km s−1 (bottom), respectively. While the colour map and contours in red displays the 1, 2, and 3σ levels of the χ2 distributions of the modelled line ratios between the 3.264 and 3.349 GHz lines (R1), the 3.335 and 3.349 GHz lines (R2), and those between the 701 and 724 MHz (R3), the contours in grey with varying line styles mark the observed line ratios of R3 for fixed values of N(CH) (as labelled) corresponding to the population in the excited level. The solid light blue curve marks the N(CH) value of the excited state for which the model is best constrained.
Current usage metrics show cumulative count of Article Views (full-text article views including HTML views, PDF and ePub downloads, according to the available data) and Abstracts Views on Vision4Press platform.
Data correspond to usage on the plateform after 2015. The current usage metrics is available 48-96 hours after online publication and is updated daily on week days.
Initial download of the metrics may take a while.