Fig. 7
Download original image
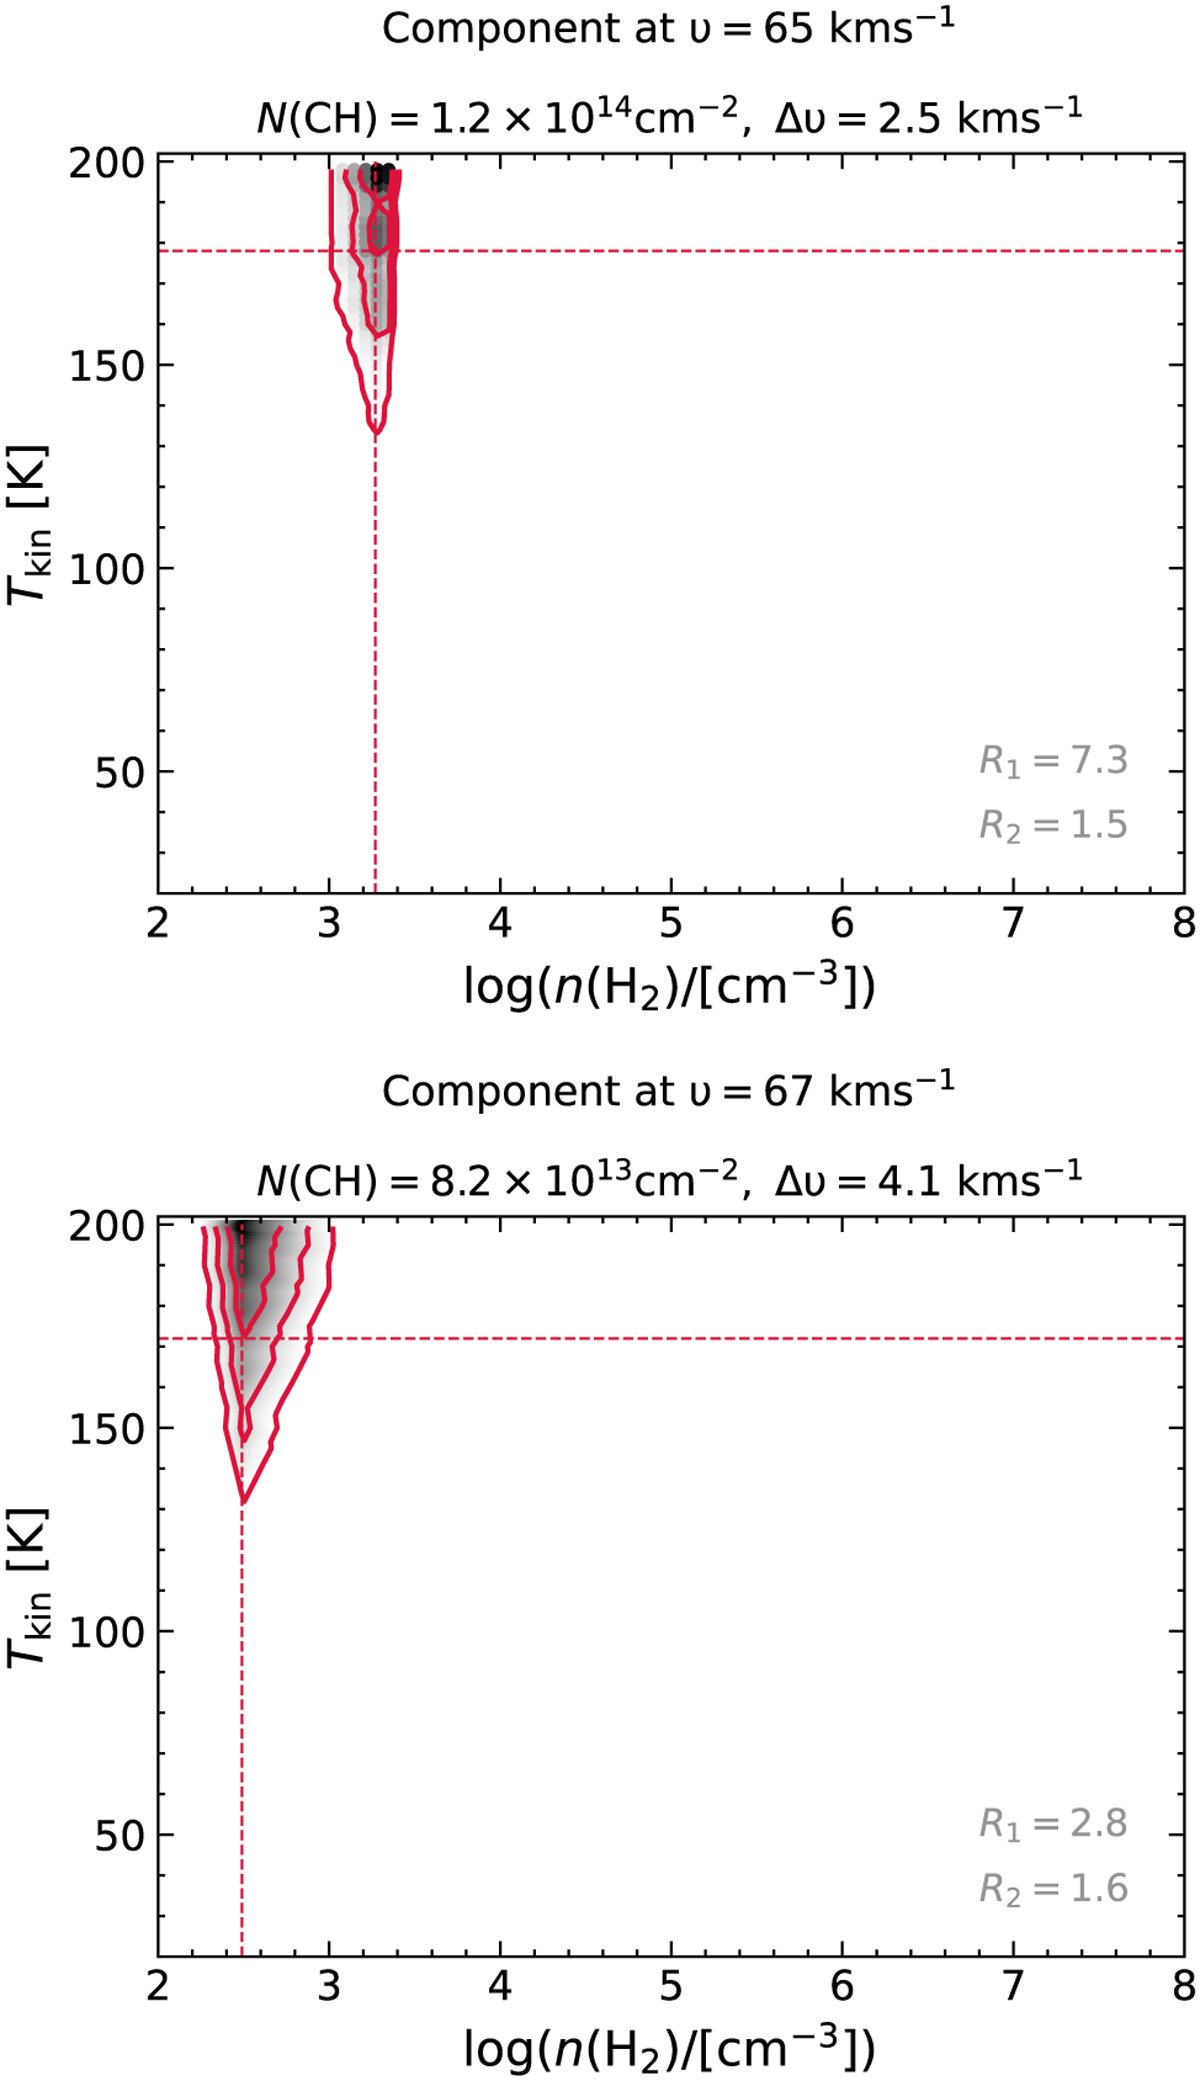
MOLPOP-CEP non-LTE radiative transfer modelling results for the W51E cloud components at υLSR = 65 km s−1 (top) and 67 km s−1 (bottom), respectively. The red contours display the 1, 2, and 3 σ levels of the χ2 distributions of the modelled line ratios that best reproduce the observed line ratios between the 3.264 and 3.349 GHz lines (R1) and those between the 3.335 and 3.349 GHz lines (R2) across the nH2−Tkin parameter space probed for the CH column densities and line widths specified above. The dashed red lines mark the minimised values and 1σ limits.
Current usage metrics show cumulative count of Article Views (full-text article views including HTML views, PDF and ePub downloads, according to the available data) and Abstracts Views on Vision4Press platform.
Data correspond to usage on the plateform after 2015. The current usage metrics is available 48-96 hours after online publication and is updated daily on week days.
Initial download of the metrics may take a while.