Fig. 5
Download original image
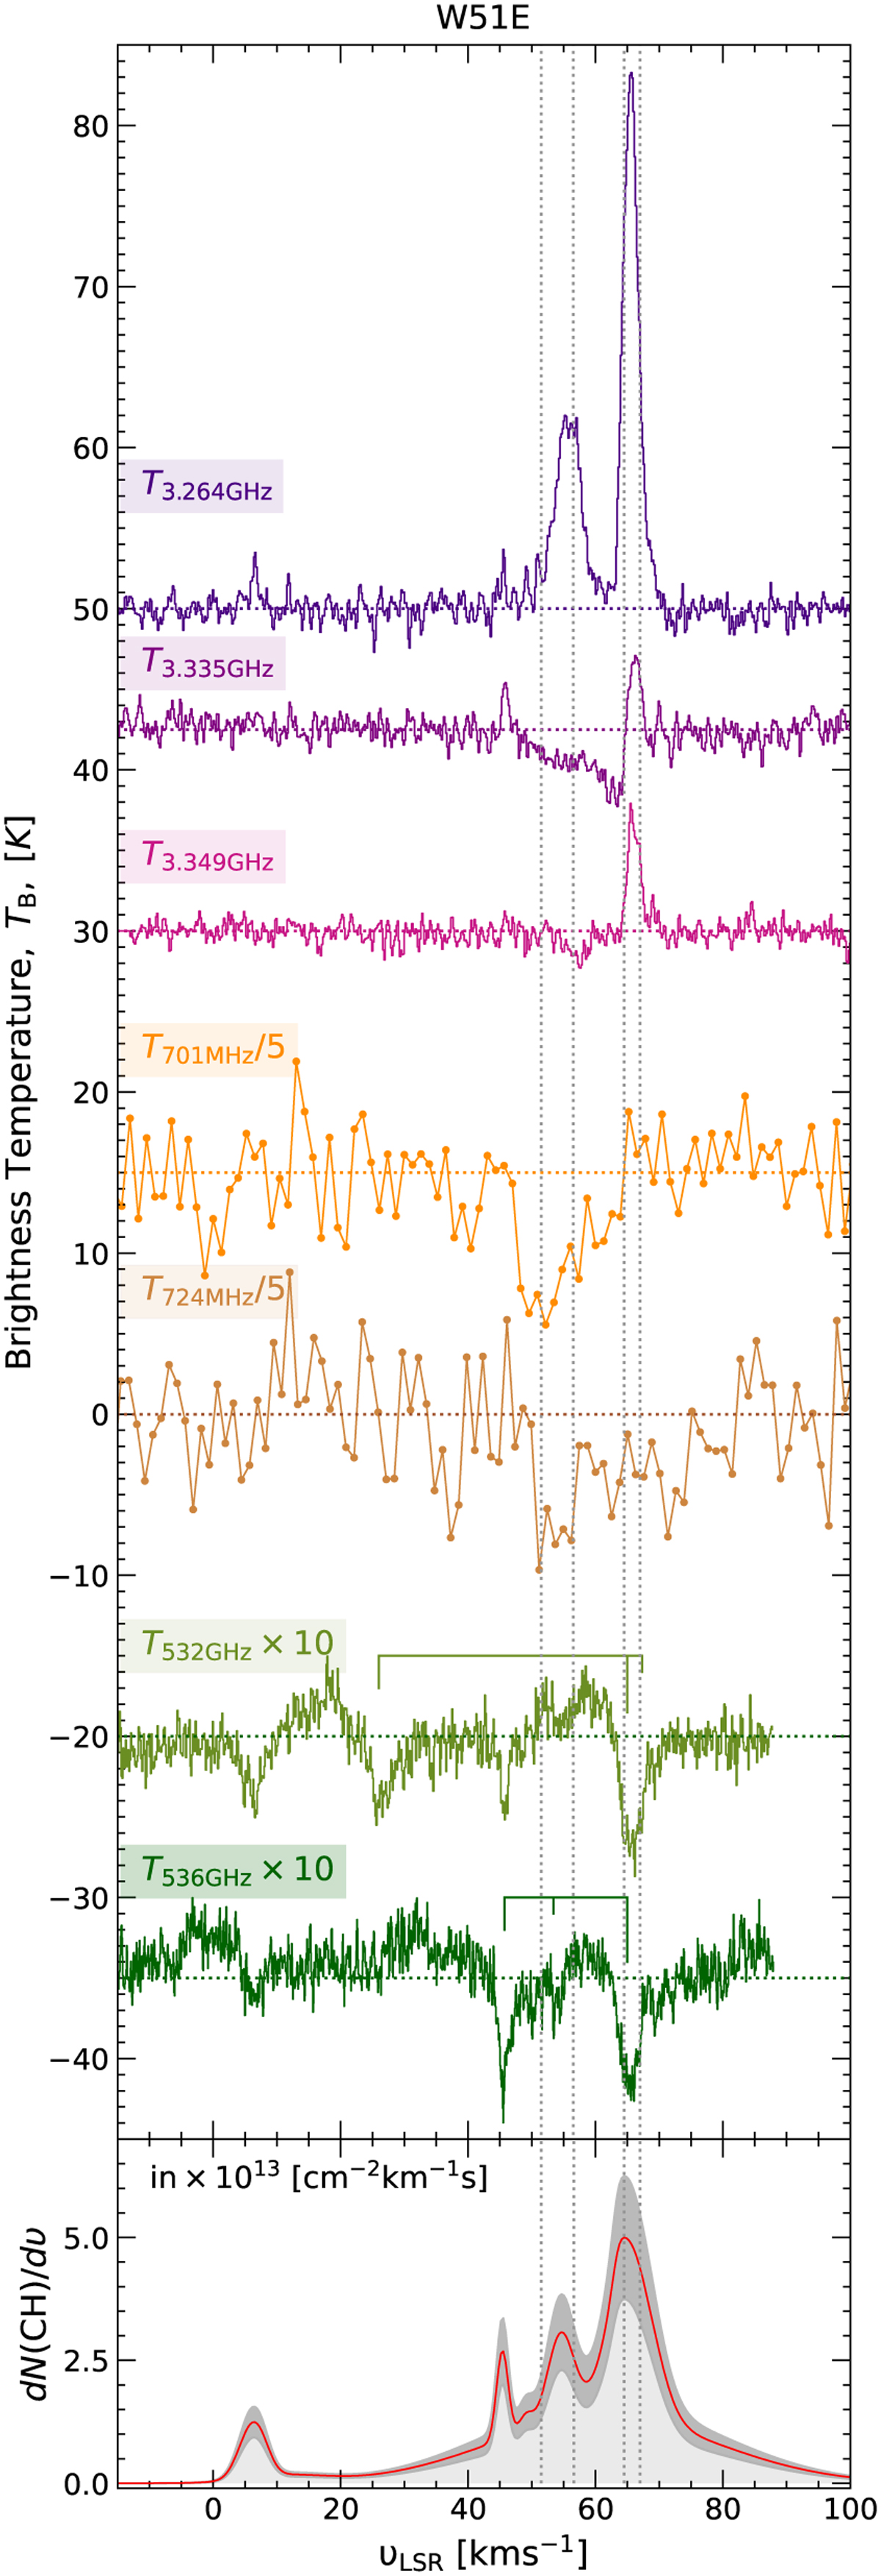
Baseline-subtracted spectra of the CH transitions discussed in this work, displayed on brightness temperature scales (top). The spectra are offset and scaled for ease of viewing. The relative intensities and positions of the HFS splitting lines corresponding to the N = 1, J = 3/2 → 1/2 rotational transitions near 532 and 536 GHz are indicated above the spectra and aligned to a velocity of 57 km s−1 corresponding to the LSR velocity of the strongest component. HFS deconvolved column density distribution of CH obtained from the N, J = 2, 3/2 → 1, 1/2 transition near 2007 GHz (bottom). The dotted grey lines mark the centroid velocities of the different Gaussian components that were fitted in Fig. 4.
Current usage metrics show cumulative count of Article Views (full-text article views including HTML views, PDF and ePub downloads, according to the available data) and Abstracts Views on Vision4Press platform.
Data correspond to usage on the plateform after 2015. The current usage metrics is available 48-96 hours after online publication and is updated daily on week days.
Initial download of the metrics may take a while.