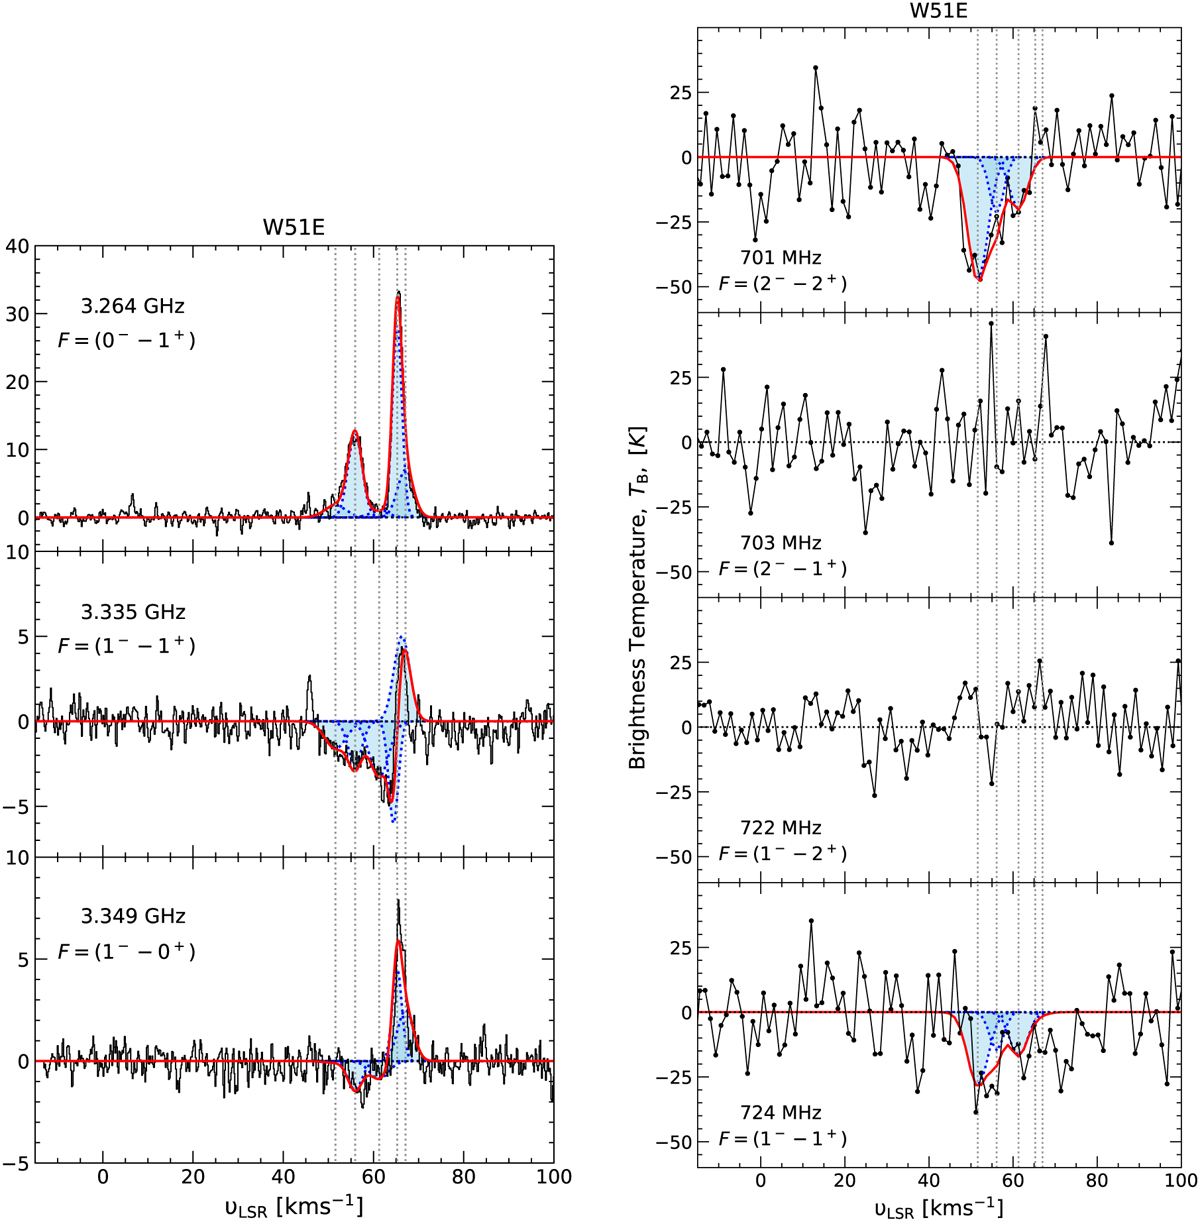
Fig. 4
Download original image
Baseline-subtracted spectra of the ground state (left), and first rotationally excited state (right) HFS lines of CH towards W51 E. The individual fits to different velocity components are displayed by dotted blue curves and highlighted by the blue shaded regions, while the solid red curves display the combined fits. The dotted grey lines mark the centroids of the different fitted Gaussian components.
Current usage metrics show cumulative count of Article Views (full-text article views including HTML views, PDF and ePub downloads, according to the available data) and Abstracts Views on Vision4Press platform.
Data correspond to usage on the plateform after 2015. The current usage metrics is available 48-96 hours after online publication and is updated daily on week days.
Initial download of the metrics may take a while.