Fig. 3
Download original image
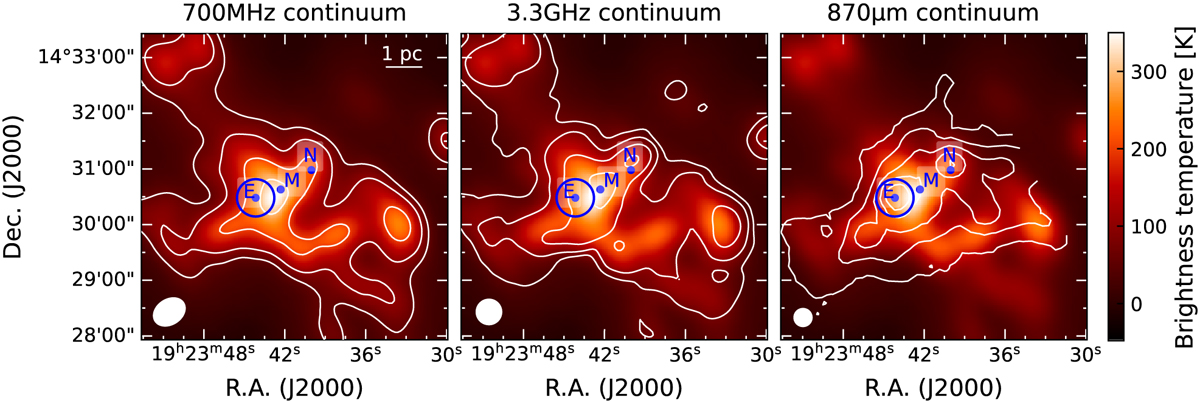
Overview of the radio continuum data. From left-to-right the panels display contours of the background continuum emission at 700 MHz, 3.3 GHz, and 870 μm (in white), respectively, overlaid atop the 700 MHz continuum emission. Labelled and marked (in blue) are the positions of the main young cluster W51 M and the two young stellar objects W51 N and E, which harbour several high mass young stellar objects at different (early) evolutionary stages. The position from which the CH spectra are extracted is marked by the beam of the Herschel/HIFI band 1a in blue. The filled white ellipse at the bottom left-hand corner of each plot displays, from left-to-right the (synthesised) beams of the uGMRT, VLA and APEX/LABOCA observations, respectively.
Current usage metrics show cumulative count of Article Views (full-text article views including HTML views, PDF and ePub downloads, according to the available data) and Abstracts Views on Vision4Press platform.
Data correspond to usage on the plateform after 2015. The current usage metrics is available 48-96 hours after online publication and is updated daily on week days.
Initial download of the metrics may take a while.