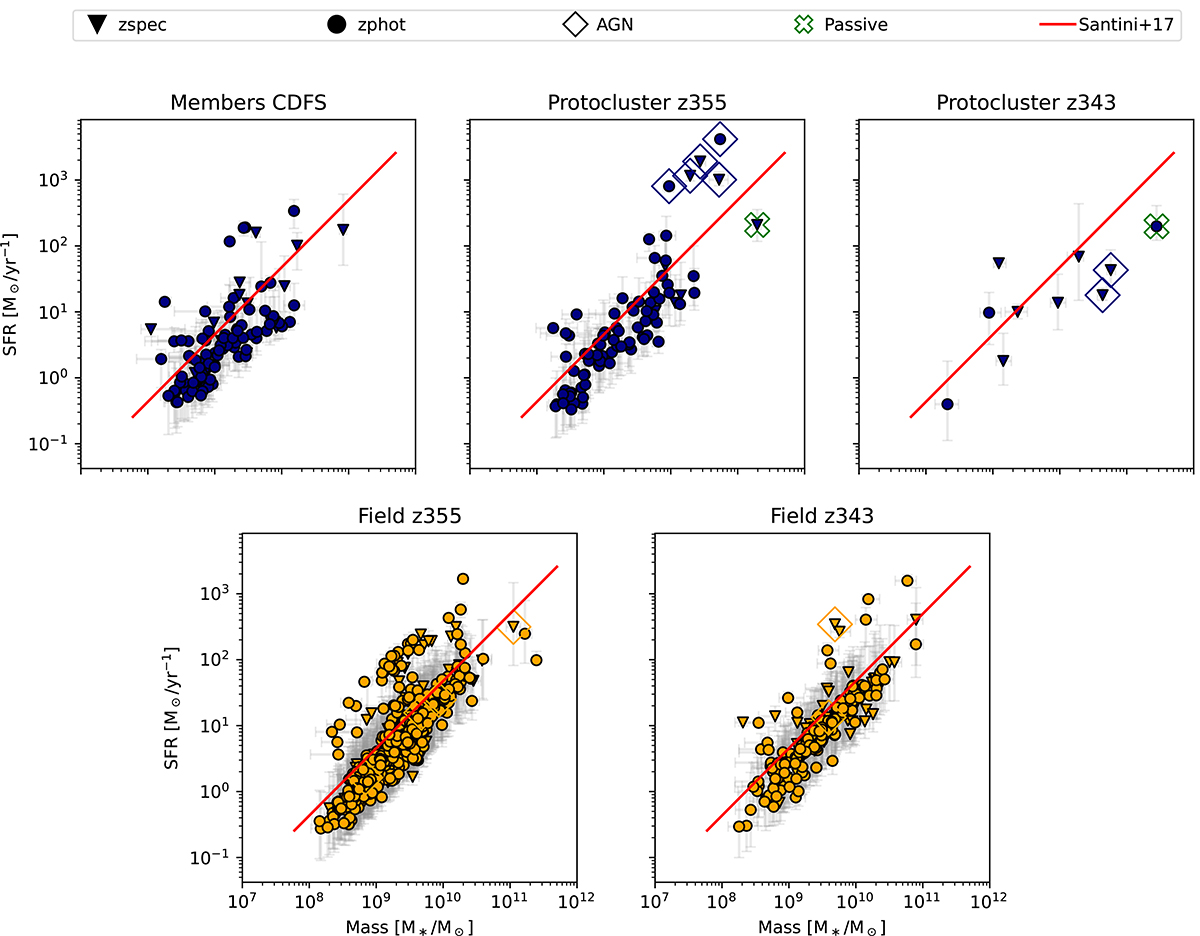
Fig. A.1.
Download original image
Star formation rate plotted against stellar mass for galaxies in different environments. Top-left: Galaxies that are members of the over-densities identified in CDFS excluding the two that host passive galaxies. Top-centre: members of the proto-cluster at z = 3.55. Upper right: members of the proto-cluster at z = 3.43. Bottom-left: field galaxies associated with the proto-cluster at z = 3.55. Bottom-right: Field galaxies associated with the proto-cluster at z = 3.43. The galaxy categories represented by the different symbols are the same as in Fig. 3.
Current usage metrics show cumulative count of Article Views (full-text article views including HTML views, PDF and ePub downloads, according to the available data) and Abstracts Views on Vision4Press platform.
Data correspond to usage on the plateform after 2015. The current usage metrics is available 48-96 hours after online publication and is updated daily on week days.
Initial download of the metrics may take a while.