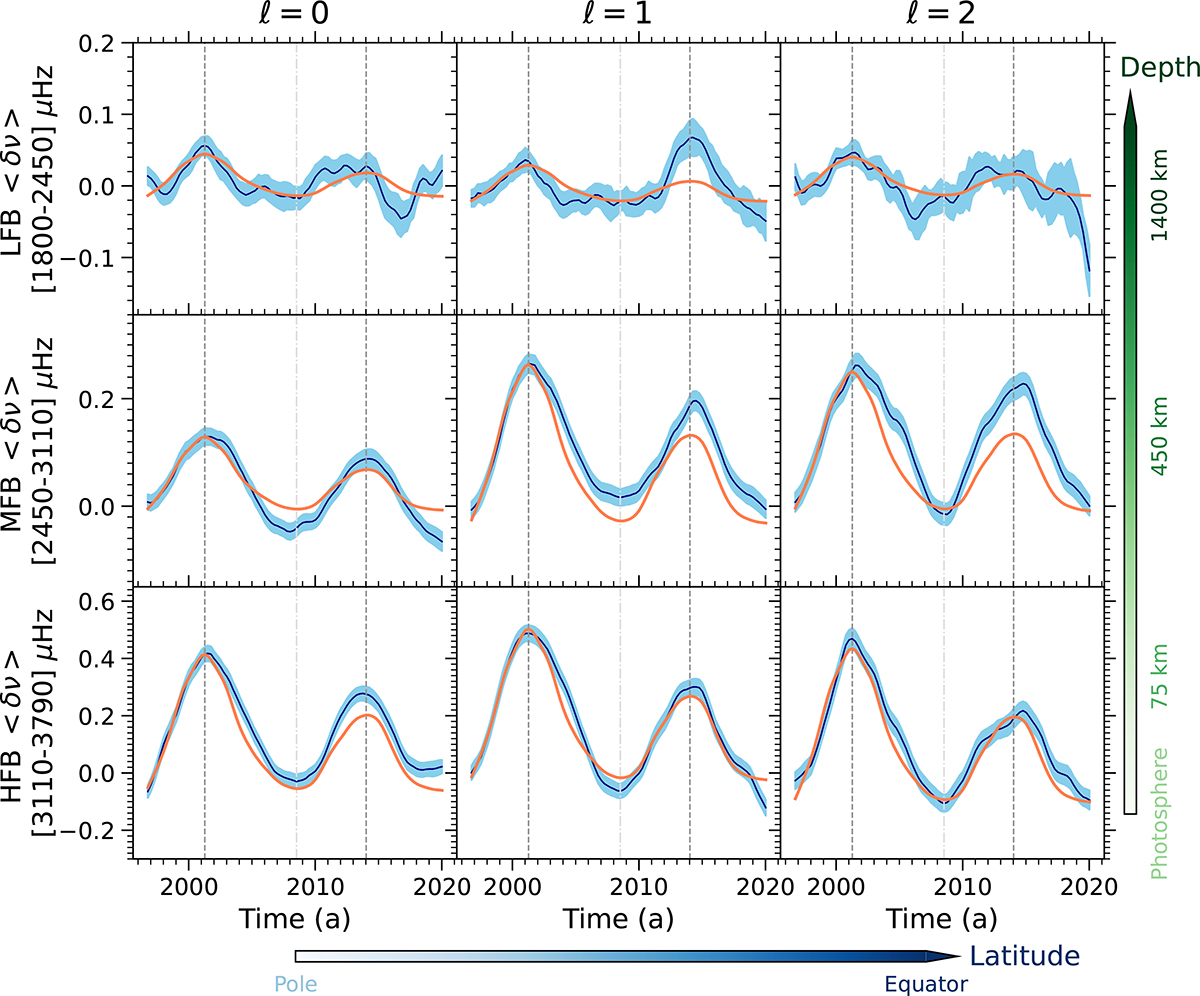
Fig. 2.
Download original image
Temporal evolution of the averaged and smoothed GOLF frequency shifts (⟨δν⟩, dark blue lines) of ℓ = 0, 1, and 2 modes (left, central, and right panels respectively). The top, middle, and bottom rows correspond to the three frequency bands considered in the analysis: 1800–2450 (LFB), 2450–3110 (MFB), and 3110–3790 μHz (HFB), respectively. Light blue regions represent the errors in ⟨δν⟩. Orange lines depict the scaled smoothed F10.7 magnetic proxy. Vertical dashed and dot-dashed lines depict the maxima of cycles 23 and 24 and the minimum in between. The horizontal blue arrow indicates the change in sensitivity from the pole to the equator, and the vertical green arrow depicts the maximum sensitivity to the depth of the subsurface layers.
Current usage metrics show cumulative count of Article Views (full-text article views including HTML views, PDF and ePub downloads, according to the available data) and Abstracts Views on Vision4Press platform.
Data correspond to usage on the plateform after 2015. The current usage metrics is available 48-96 hours after online publication and is updated daily on week days.
Initial download of the metrics may take a while.