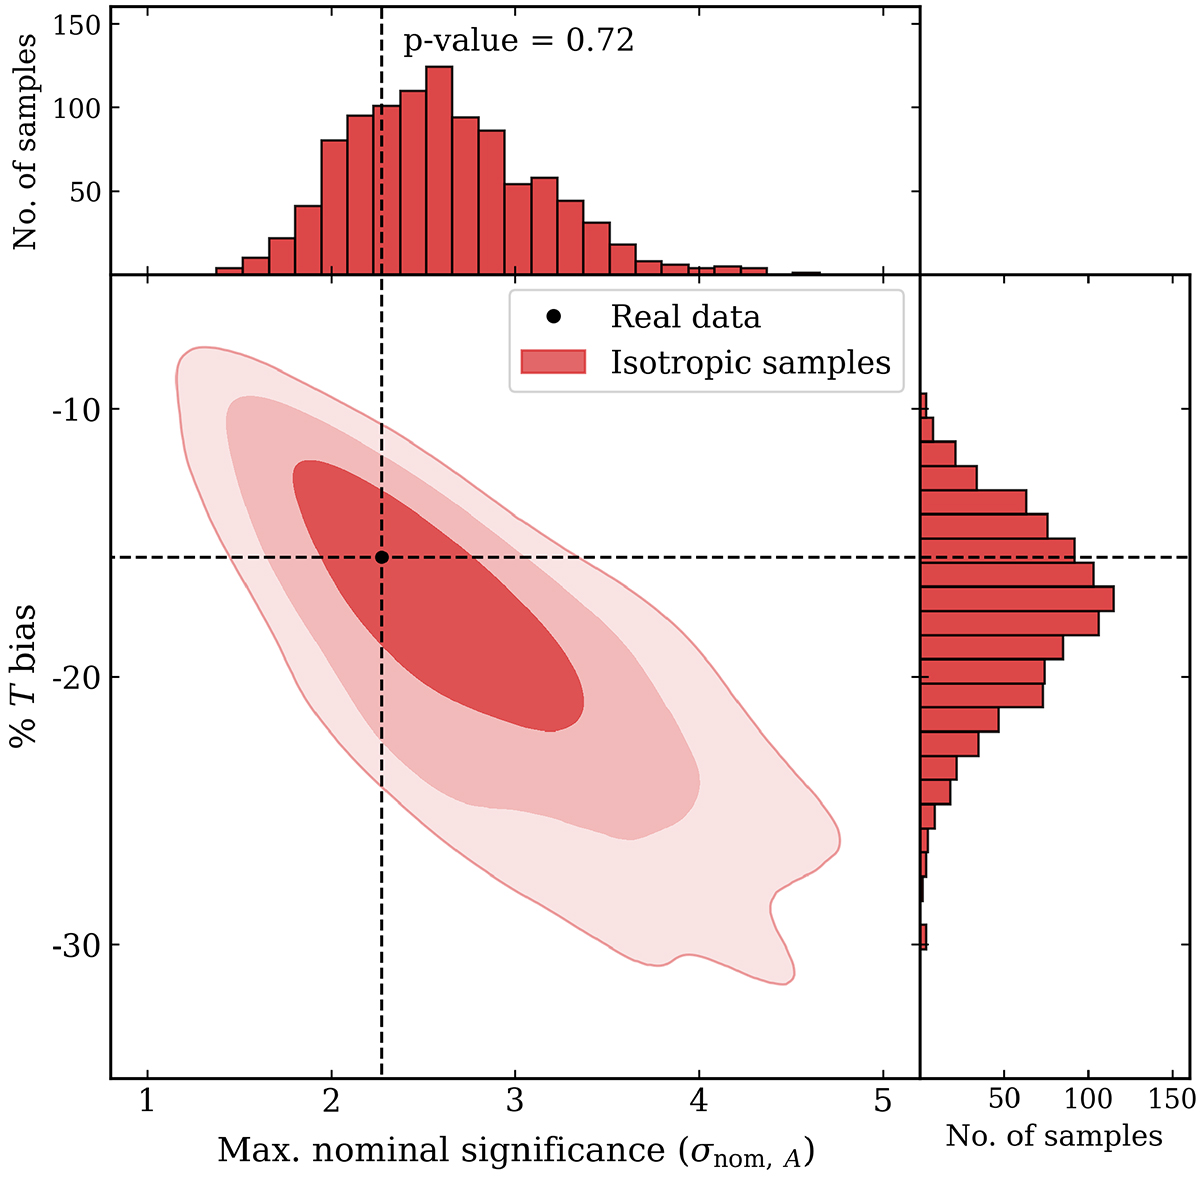
Fig. 6.
Download original image
Distribution of maximum nominal sigma values and its %T bias obtained from the 1000 isotropic Monte Carlo simulated samples of the σv − T relation. Shaded contours represent 68%, 95%, and 99% confidence levels. The value obtained in the real data is shown by a black dashed line on the histograms and by a point on the contour plot. The p-value in the histogram of maximum nominal sigma values represents the probability of getting higher nominal significance than the real data.
Current usage metrics show cumulative count of Article Views (full-text article views including HTML views, PDF and ePub downloads, according to the available data) and Abstracts Views on Vision4Press platform.
Data correspond to usage on the plateform after 2015. The current usage metrics is available 48-96 hours after online publication and is updated daily on week days.
Initial download of the metrics may take a while.